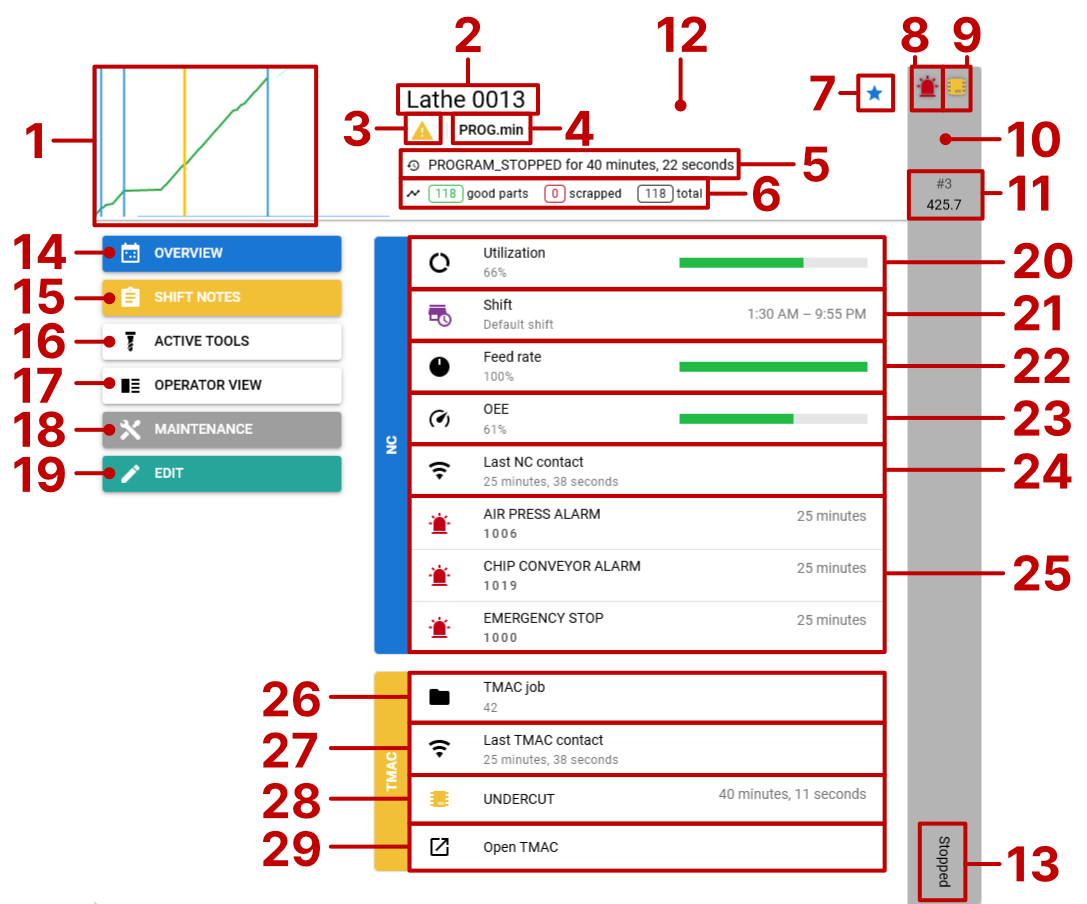
Anatomy of a machine card
Collapsed view
- Production chart preview. Click to open the production page for this machine.
- Machine name. This can be changed from the machine editor.
- Process name. If there is an active process, click here to open the process details page. If there is no active process, a warning symbol will show here instead (as pictured above). Learn more about processes →
- Program name. Clicking it will open the program editor. Learn more about programs →
- Machine cycle state as reported by the control.
- Part counts. If a goal is available, it will also appear here.
- Favorite toggle button. Click to favorite or un-favorite this machine. Non-favorite machines can easily be hidden from the filter menu on the machines page.
- NC alarm indicator. Appears when there is an NC alarm. If the machine is emergency stopped, a stop sign will appear instead. Flashing can be controlled in your user settings.
- TMAC alarm indicator. Appears when there is a TMAC alarm. Flashing can be controlled in your user settings.
- Color of the current state. Learn more about states →
- Display variable defined by the current process. This can be turned off in your user settings.
- Click here to expand or collapse the machine card.
Expanded view
- Name of the current state. Learn more about states →
Left buttons
- Overview button. Click to open an overview of production on this machine for an entire year at a time.
- Shift Notes button. Click to submit or view shift notes for this machine.
- Active Tools button. Click to open the tools page showing only the tools in use on this machine.
- Operator View button. Click to open a side-by-side view of the production chart and tools for this machine.
- Maintenance button. Click to view maintenance items for this machine.
- Edit button. Click to open this machine in the machine editor.
NC details
- Utilization. Click to open the states page.
- Current shift. Click to open the shift manager. Learn more about shifts →
- Feed rate reported by the control.
- Current OEE. Click to view the OEE history for the machine. Learn more about OEE →
- Last NC update from the proxy
- Current NC alarms
TMAC details
- Current TMAC job name
- Last TMAC update from the proxy
- Current TMAC alarms. Will not be shown if there are no current alarms.
- Open TMAC button. Click to open the TMAC web interface in a new tab.
