No edit summary |
No edit summary |
||
| Line 1: | Line 1: | ||
[[Category:AutoComp]] | [[Category:AutoComp]] | ||
[[ | [[AutoComp|Back to AutoComp Home Page]] | ||
== '''Run Data: Overview''' == | == '''Run Data: Overview''' == | ||
Latest revision as of 12:44, 26 October 2022
Run Data: Overview
Run data for the currently loaded routine are displayed in the Run Screen, which occupies most of the Main Window. Four formats (views) are available in which to view the data. Some parameters can be edited in an active routine using the Detail view.
In addition, AutoComp’s historical run data log files that show each dimension and all of the limits and parameters can be viewed in Notepad or MS Excel.
Run Screen
The Run Screen is the large area taking up most of the Main Window, beneath the Main Window tool bar. This is where run data are displayed.
Run data can be viewed in any of four views. There are differences in the run window display depending on:
- Which run data view (History Chart, Grid, Details, or Part) and
- Whether AutoComp is in Setup or Production operation mode.
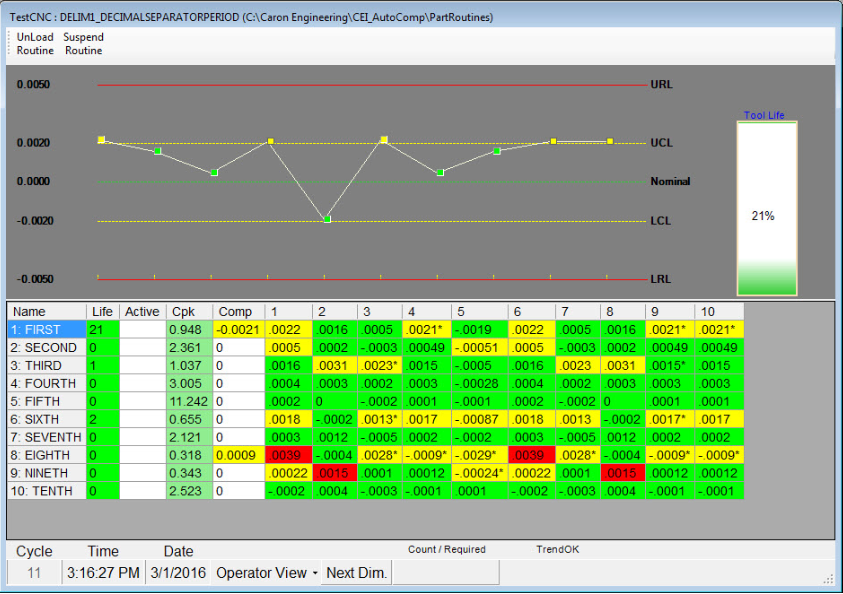
The above screen capture shows the Run Screen in production mode in View Chart.
Run data views and operation modes are explained in the sections that follow.
Choice of Run Data Views
The following four run data views are available:
- View Chart: This view shows run data for a selected dimension in graph format, and the full routine (all dimensions) in a numerical grid. A tool life indicator box on the right-hand side of the chart shows tool wear for the selected dimension as the current percentage of the tool life value.
- View Grid: This view shows run data for all dimensions in a numerical data grid. In addition to the stand-alone Data Grid view, the grid is displayed at the bottom of the History Chart view.
- View Details: This view shows detailed numeric data for the selected dimension. Some dimension parameters can be edited in Details View.
- View Part: This shows a photograph or drawing of the part, with the measurements of dimensions marked. An image of the part can be loaded. Then dimensions can be specified whose data is to be viewed.
Choice of Operation Mode
AutoComp can run in either of two operation modes, Production Mode or Setup Mode. This affects how data are displayed, as explained below. (The operation mode is set in the User Options window.) Chose either production mode or setup mode.
Production Mode: In production mode (automatic compensation mode), gage data are analyzed by AutoComp, tool compensation is automatically sent to the CNC, and the run time data display is updated.
Setup Mode: In setup mode, in all views except Details, the gage data are active until the operator chooses to Accept or Cancel the cycle. While in setup mode, any dimension can be re-measured until its cycle or sub-cycle is accepted or canceled. Re-measurement over- writes the data in effect canceling the old measurement for that dimension.
Opening and Closing the Run Screen
Use the Load Routine button to activate a Run Screen. (Routines are also loaded automatically as gage data files are detected by AutoComp.)
Close the Run Screen by using the Unload Routine or the Suspend Routine button in the Run Screen’s upper tool bar. A routine can not be loaded if a routine is already loaded.
- Unload: Closes the routine and sets it to open with all dimension data initialized, including Trend and Skip data, the next time it is loaded.
- Suspend: Closes the Routine, but maintains the historical data for display the next time the routine is opened. When AutoComp automatically loads a routine as gage data files are detected, the currently loaded routine is suspended.
Run Screen Basic Components
No matter which run data view is chosen, the Run Screen always has the following basic components:
- Title Bar (at the top of the Run Screen): States the CNC inter- face device followed by a colon and the name of the routine, and followed by parentheses containing the RunData:Process Data Tag, as shown in the screen capture below.
- Upper Run Screen Toolbar: Allows the user to Unload or Suspend Routines, and if in setup mode, to Accept or Cancel Cycles (the manual gaging buttons).
- Run Screen display area (the large area in the middle), where data can be viewed, in History Chart, Details, Grid, or Part view.
- Run Screen Tool and Status bar (at the bottom of the Run Screen): Shows the Cycle number, current Time, and current Date. The Count/Required field lists both the gage required count value ("Count") and the gage required macro variable value ("Required").
Run Screen Tool and Status Bar
The tool and status bar at the bottom of the Run Screen, displays current cycle data, including:
- Cycle: This shows the number of cycles that the current routine has run. Each cycle represents one part that has been (or is being) gaged. This is cumulative until the routine is unloaded.
- Time: The current time (HH:MM:SS A/PM format).
- Date: The current date (MM/DD/YYYY format).
- Count/Required: If a system uses either Okuma P200, P300, or a Focas 1 or 2 control, this field shows the cycle count and the count number at which gaging is required.
- TrendOK: If using timer variables, when the reset time is over, this field lists the cycle number of the routine at which the trend reset ended.
The tool and status bar also includes the following two buttons:
- Operator View: This displays a dropdown menu that allows selecting the run data view.
- Next Dim: This button allows selecting which dimension to display as “active” in the Run Screen. Use the Next Dim button to cycle through all the dimensions to return to a previous dimension.
Clicking on any dimension name will also highlight that dimension and display its graph and Tool Life Indicator panel in the Run Screen.
Count/Required
For controls allowing ethernet variable read/write functionality, the number of cycles that can run before part measurement (gaging) is required can be specified during routine creation.
This information is displayed in the Count/Required field in the Run Screen tool and status bar.
The number on the left is the actual count and the number on the right is the number at which gaging is required.
While the Count number is 75% or less of the Required number, the field is green. When it reaches 76% the field is yellow. Above 95% it goes red.
In the above screen shot of the Count/Required field of the Run Screen tool bar, seven cycles have been counted. At 25 cycles, gaging is required. Since the Count has not reached 75% of the Required number, the field is green.
In the screenshot above, 24 cycles have been counted, and gaging will be required after the next cycle, so the field is red.
Note: The Count/Required field only alerts the operator. It does not trigger any action by AutoComp. If the operator takes no action, the actual count number will continue to increase. The part program is responsible for incrementing the variable on each part cut, and to reset it when gaging is done. AutoComp will never set this variable, but only displays it for the operator.
Run Screen Upper Tool Bar
The Run Screen upper tool bar allows unloading and suspending routines, and if in setup mode, it lets allows manual gaging using the Accept Cycle and Cancel Cycle buttons.
Unload, and Suspend Routine Buttons
The Unload Routine and Suspend Routine buttons are on the left hand side of the Run Screen upper tool bar.
- Unload: Closes the routine and sets it to open with all dimension data initialized the next time it is loaded.
- Suspend: Closes the routine, but maintains the historical data for display the next time the routine is opened. When AutoComp automatically loads a routine as gage data files are detected, the currently loaded routine is suspended.
Routines are loaded using the Load Routine button.
Manual Gaging Buttons (Setup Mode Only)
In Setup Mode, an operator can manually activate gaging. This is done using the manual gaging buttons (Accept Cycle and Cancel Cycle. A cycle is complete if all of the critical dimensions are measured (with values displayed in the Run Screen's Active column.
These buttons are displayed on the left hand side of the Run Screen upper tool bar in setup mode only.
The two manual gaging buttons are:
- Accept Cycle: Accepts the part just gaged, which is still in the Active column of the Data Grid. When a part is accepted, AutoComp performs the tool compensation calculations for the part and saves the measurements. If tool compensation is enabled, a compensation is sent to the CNC if necessary. The part moves from the Active column to its Cycle column in the Data Grid.
- Cancel Cycle: Cancels the part just gaged, which is still in the Active column. When a part is canceled, no calculations are performed and the Active column is cleared.
Note: If in setup mode, gage data files can queue up, and a cycle must be accepted or canceled before the next file can be displayed.
Run Data Views
The Operator View button on the Run Screen’s tool/status bar displays a menu where the run data view options: View Chart, View Grid, View Details, or View Part. These views are discussed in the sections that follow.
Note: In all of the run data views, the gage data are color-coded to indicate tolerance status:
- Gray indicates that there are no data.
- Green indicates that the reading was within nominal to wear limits.
- Yellow indicates that the reading lies between the reject limit and the compensation limit. Depending on the system con- figuration, (for example whether or not Comp After Wear Limit, Comp On Reject, or Trend is selected), the dimension may or may not be compensated.
- Red indicates that the reading is outside of reject limits.
View Chart
The Chart View shows graphed gage data and the compensation history of recent gage cycles. Chart View is the default view for run data.
If the Run Screen is not already in Chart view, press the Operator View button at the bottom of the Run Screen and select View Chart to display run data in Chart Mode.
There are three parts of the Chart View:
- The Data Grid is in the lower half of the Run Screen.
- The Chart Graph is in the top half of the Run Screen.
- The Tool Life Indicator is the vertical rectangular panel to the right of the graph if a wear limit was set for the selected dimension.
Each numbered column in Data Grid represents a gage cycle, and each row represents a dimension in the routine. For the dimension (row) highlighted in the Data Grid, the most recent gage cycles are displayed graphically in the Chart Graph (up to ten can be displayed at a time). Each point marked by a square in the Chart Graph represents a gage cycle (the measurement for the displayed dimension for that cycle).
Note: When configuring AutoComp, the number of viewable data cycles can be determined. In chart, ten cycles can be viewed at a time. If the number of data cycles is set to more than ten, a scroll bar allows scrolling through the cycles. The last cycle (represented by the right-most square “point”) in the graph corresponds to the last column in the data grid below the graph.
The more cycles are viewable in the grid, the LONGER it will take to load a routine, as the grid must be filled with the historical data. This could affect processing time, and should be tested by the operator, to find an acceptable balance.
Data Grid
Use the Data Grid to select the dimension whose data is to be seen in the Chart Graph. Press anywhere in the row to see the dimension in the graph.
The Data Grid shows numeric values for all gaged dimensions.
- Each numbered column represents a data cycle.
- Each row represents a dimension in the current routine.
The data for all the dimensions for the ten most recent cycles are displayed numerically in the numbered columns. If the system is con- figured for more than ten cycles, there is a scroll bar below the Data Grid. When using the scroll bar to scroll through the cycles, both the columns in the grid and the points in the graph change to reflect the values for the cycles.
Note: The Data Grid can be viewed alone by selecting View Grid from the View menu.
Chart Graph
The line graph in the upper portion of the Run Screen is the Chart Graph.
The green, yellow, and red lines represent the nominal, compensation, and reject limits programmed for the dimension. Each small square in the graph (called a “cycle box”) indicates a gage cycle’s compensation status for the selected dimension:
- Non-bordered boxes represent cycles that were not compensated. The box on the left in the above screen shot is a non-compensated cycle.
- Bordered boxes (with dark boundaries) represent cycles that were compensated. The box on the right, above, with the black boundary, is a compensated cycle.
Up to ten gage cycles can be displayed at a time in the graph. If the system is configured for more than ten cycles, there is a scroll bar below the Data Grid. When using the scroll bar to scroll through the cycles, both the columns in the grid and the graph change to reflect the values for the cycles.
Viewing Cycle Data
Each cycle box also holds additional data. By moving the cursor over or near the square (but not clicking the mouse button), data for that cycle can be viewed:
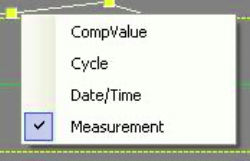
Four types of data can be chosen to view in the cycle box:
- Cycle number
- Date/time of cycle completion
- Measurement
- Compensation value.
Choosing and Setting Cycle Data Type
Set the type of data viewable in the cycle boxes as follows:
- Move the mouse onto “open” space on the graph (not on any point) and right click.
- Select the type of data to be viewed in the cycle boxes. Move the cursor over or near the cycle box and click the right mouse button. Use the left mouse button to select the type of data to be viewed.
- This will be the kind of data that is displayed for each cycle box until the data type is reset.
Note: There is a column in the grid to display the last cycle's comp value for each dimension.
Tool Life Indicator
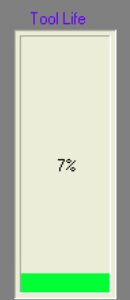
The Tool Life Indicator (the rectangular box at the right of the His- tory Chart) shows tool wear as the current percentage of the tool life value that was entered in the Routine Editor for this dimension.
- Gray indicates that the tool has not been used.
- Green indicates that the tool life is well within limits.
- Yellow indicates that the tool life has exceeded 75% of its programmed value.
- Red indicates that the tool life has expired.
Click this indicator or use the Details View to change tools and reset the tool wear (percentage of tool life) to zero. Both tool axes can be cleared, or just the axis defined for the dimension in the routine editor.
When using the Change Tool button or clicking the Tool Life Indicator to clear a tool, selecting Yes clears all axes. All other dimensions in the Routine defined to that same tool will also be cleared. This includes matching dimensions with different Cut Positions for Okuma CNCs, and dimensions with different Edges for Siemens CNCs. This does not include matching dimensions with different Edges for Okuma controls.
Clicking No clears only the selected dimension. Clicking Cancel clears nothing.
For controls supporting ethernet variable and offset read/write functionality, the associated offset, wear offset or variable can also be cleared by setting the system configuration variable: Clear Offset on Tool Change.
Grid View
The Data Grid can be viewed alone by selecting View Grid from the Operator View menu. It shows numeric values for all gaged dimensions. (In Chart view, it is displayed in the bottom half of the Run Screen, below the Chart.)
- Each numbered column represents a data cycle.
- Each row represents a dimension in the current routine.
Reading the Data Grid
Each numbered column represents a cycle. If the system is configured for more than the number of cycles that can be viewed in the window, there is a scroll bar below the Data Grid. When using the scroll bar to scroll through the cycles, the columns change to reflect the values for the cycles. Each row in the Data Grid represents a dimension in the current routine.
Each row holds the following data:
- Dimension number: The numerical order of the dimension in the dimension list; this resides under the Name column and is followed by a colon.
- Name: The name chosen for this dimension. (This follows the colon after the dimension number, in the Name column.)
- Life: The percentage of tool life expectancy used if con- figured for the selected dimension.
- Active: Represents the current part measurements. If AutoComp is in production mode, these values are automatically processed and moved to the newest cycle column. If AutoComp is in setup mode, the measurements remain in the Active column until the operator Accepts or Cancels the cycle.
- Cpk: AutoComp can calculate and display the Process Cap- ability Index for each dimension in a routine. The desired Cpk is set in the routine editor. Cpk will not be calculated unless there are at least five cycles of measurement data.
- Comp: Displays the compensation for the last recorded measurement of each dimension. If there was a compensation the field will be yellow, otherwise the field is white.
- Number (x...): Represents a particular cycle in the current routine. Only ten cycles are displayed at a time.
An asterisk (*) following the data indicates that the value caused a compensation to be sent to the CNC.
An ‘ng’ following the data indicates that the CNC flagged the tool as expired (‘not good’).
An ‘E’ appended to the data indicates an error has been reported back from the CNC. When the CNC reports such an error, it will be written to the log file.
Detail Chart View
Select View Details from the Operator View menu to put the Run Screen in Detail Chart mode. Use the Detail Chart to view para- meter values for the active routine, edit the active routine's parameters, and change tools.
The Detail Chart displays limits and settings for the current routine’s selected dimension.
Edit Parameters Buttons
Use the Detail Chart to edit parameters in an active routine without having to close the routine and use the Routine Editor.
Note: If substantial edits are needed, the routine should be unloaded or suspended, and the Routine Editor should be used to make edits. The Detail Chart’s editing capability only allows editing a limited number of parameters.
To make edits using the Detail Chart:
- Press the Edit Parameters button in the Detail Chart.
- Select and enter new value(s) in the appropriate parameter field(s).
- Press Apply.
Change Tool Button
The Change Tool button allows the user to reset accumulated tool life when tooling is changed in the machine. All tool axes can be cleared, or just the Dimension axis.
When using the Change Tool button to clear a tool, selecting Yes clears all axes. All other dimensions in the Routine defined to that same tool will also be cleared. This includes matching dimensions with different Cut Positions for Okuma CNCs, and dimensions with different Edges for Siemens CNCs. This does not include matching dimensions with different Edges for Okuma controls.
Clicking No clears only the selected dimension.
Clicking Cancel clears nothing.
For controls with Ethernet offset or variable read/write support, the associated offset, wear offset or variable can also be cleared by setting the system configuration variable: Clear Offset on Tool Change.
Part View
Select View Part from the Operator View menu to put the Run Screen in Part View. Use Part View to graphically view run data for each dimension on a part. The part image and a tool bar display run data dynamically.
Note: The Main Window may need to be re-sized so that the image displays optimally.
The two main features of the Run screen in Part View, are the Part Image, and the Part View Tool Bar.
Part View Image
In the Routine Editor, specify a photograph or drawing of a part (.jpg file only) and label any or all dimensions on the part.
Run data are then displayed numerically in these labels when the routine runs, and the data field in the label takes on the appropriate status color (green, red, yellow, or gray).
Part View measurements will be set to a white background at the start of each cycle to make it easier to follow a new cycle of data.
Part View Tool Bar
In Part View, the tool bar near the bottom of the Run Screen enables several functions:
- Dimension Drop-down Menu: Use this to select the dimension to add or delete, or whose limit information is to be viewed in the dimension information bar at the right of the tool bar.
- Dimension Information Bar: The colored bar to the right of the dimension drop-down menu shows the nominal (green), wear limit (yellow), and the reject limit (red) for the selected dimension.
- Clear Cycle Button (in the middle of the tool bar): This but- ton removes the status colors for each dimension in a cycle (the numbers remain however). When a new cycle is loaded, the appropriate colors are again displayed for the new cycle. This feature allows the user to easily see when the new data arrives, as it is colored to reflect compensation status.
- The buttons on the left side of the tool bar mark measurements.
Reading Run Data in Part View
When AutoComp receives run data for the routine that is loaded, the data are displayed in the labels for each dimension that are marked on the photograph or drawing of the part.
Note: The color of the rectangle containing the run data reflects the status of that dimension.
- White: Indicates the beginning the start of a cycle.
- Gray: Indicates that the tool has not been used or the data are missing.
- Green: Indicates that the dimension was within upper and lower reject limits.
- Yellow: Indicates that the reading lies between the reject limit and the compensation limit. Depending on the system configuration, (for example whether or not Comp After Wear Limit, Comp On Reject, or Trend is selected), the dimension may or may not be compensated.
- Red indicates that the cycle is outside of reject limits.
If no data are loaded, the rectangle containing the data is white. Also, the Clear Cycle button removes the status colors for each dimension in a cycle. When a new cycle is loaded, the appropriate colors are again displayed for the new cycle.
Selecting a Part View Picture
AutoComp can use any .jpg file in Part View. To select a file for use with Part View:
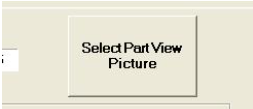
1. In the Routine Editor's Routine Parameters tab, press the Select Part View Picture button.
2. Select the file and press Open.
The file is then displayed in the button:
This picture will be displayed for this routine in Part View. The button with the picture in it can still be pressed to
browse again to a different .jpg file.
Marking Measurements in Part View
Each dimension must be marked (labeled) to view data graphically for that dimension.
- Using the drop-down menu toward the right of the Part View tool bar, select the dimension to label
- Press the Mark Measurement button on the left side of the tool bar.
- The Mark Measurement button toggles to Clear Measurement, which can be used if a mistake is made in placing the first measurement marker.
- In the part image, click on the exact spot that marks one end of the linear dimension.
- Click to place another measurement marker to mark the end point of this dimension.
- The complete measurement is displayed. The measurement consists of two measurement markers, a connector line, and the rectangle containing the run data (the data field). For the sake of convenience the entirety is sometimes referred to as the “label” or the “measurement.”
- When finished, press Save Measurement.
- After pressing Save Measurement, the button toggles to Delete Measurement.
To delete a measurement after it is saved, perform the following steps:
- Select the dimension from the dropdown menu
- Press Delete Measurement
- Press Save Measurement.
Changing Measurement Colors in Part View
In Part View, a measurement consists of the following components:
- Two “measurement markers”
- A “measurement connector” line between the two markers
- A line called the “label” from the measurement connector to the data rectangle
- The data field.
For the sake of convenience the entirety is sometimes referred to as the “measurement.” Colors can be specified for all of the parts of the measurement except for the data field, whose color automatically reflects the compensation status of the dimension for the current cycle: green, yellow, red, or gray. All of the dimensions in a routine have the same measurement color scheme (whatever color scheme is specified).
Change the measurement color scheme as follows:
- Press the Change Colors button.
- In sequence, dialog boxes prompts the user to change the “measurement marker” color, the “measurement connector” color, and the “label” color (the line from the measurement connector to the data field). After pressing OK in the dialog box for a measurement component, a color selection box appears for that measurement component where the color is selected. Press OK.
- After specifying the color for each measurement component, press Save Measurement for the color change to be saved.
Note: If measurements have already been marked in the old color scheme, the new color scheme is not displayed until the current measurement is saved.
Run Data Log Files
AutoComp automatically creates and stores run data log files containing each dimension and all the limits and parameters programmed into a routine. These run-data files are ASCII comma-delimited text files with a .csv extension. These files are saved in the RunData folder or the process data tag sub-folder (if that option is enabled), as set in the system configuration process. (The default location is /RunData.) These files can be opened in Notepad or MS Excel.
Each time a routine is loaded, a run data file is created. The run data log file accumulates data as long as a routine is open. When a routine is suspended and then reloaded, data continues to be appended until the routine is unloaded. When the routine is unloaded, the file is saved. When the routine is loaded again, a new run data file is created.
Run data files can also be marked with life times, using system con- figuration parameters. If using this option, new run data files are cre- ated based on the timer. See Run Data Reset Days, Hours, and Minutes.
Each run data log file is named as follows:
<routine(machine)> <timestamp>.csv ADEMO_ZANCHOR(TestCNC) Feb 28 2012 18_17_27.log
Data files can be purged manually, or AutoComp can be configured to purge them daily, weekly, or monthly.
Run Data File Format
Run data files contain all data relating to each dimension in a routine.
The following are all the fields in a run data file.
Note: The reserved columns are not shown.
