No edit summary |
No edit summary |
||
| Line 1: | Line 1: | ||
[[Category:Detect-IT]] | [[Category:Detect-IT]] | ||
[[ | [[Detect-IT|Back to Detect-IT Home Page]] | ||
== '''Overview''' == | == '''Overview''' == | ||
Revision as of 13:35, 26 October 2022
Overview
The Data Collection analysis collects various data types from the selected sensor. DTect-IT will gather data from the sensor and store it to a selected data logging output type. Due to the large amount of data the CEI sensors output, settings that adjust which data points are saved to the file are available.
Data Collection Wizard
The Data Collection Analysis wizard eases the setup of a Data Collection Analysis by guiding the user through the settings step by step. To set up a new Data Collection Analysis, click the Create button in the General Settings menu and select Data Collection. This launches the Data Collection Analysis Wizard. Perform the following steps in the wizard to create the analysis:
- Press Begin.
- Select or Create a new sensor for the analysis to utilize.
- Select a Channel and Unit Type from the drop down menu.
- Select a filtering mode.
- Enter a name for the analysis and Press Finish. After finishing the analysis, the Data Collection analysis settings menu will be opened.
Data Collection User Interface
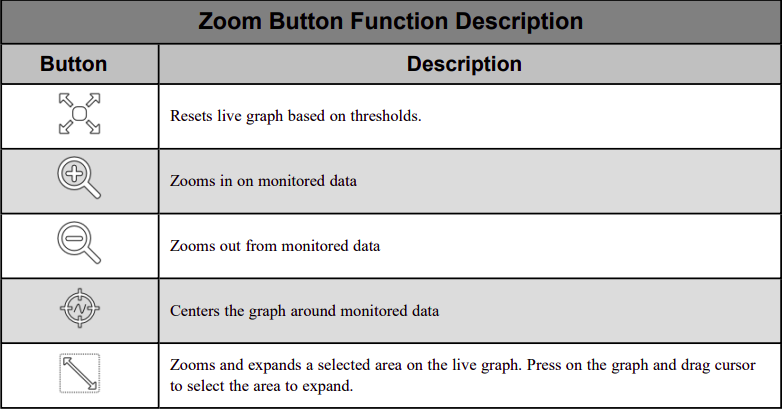
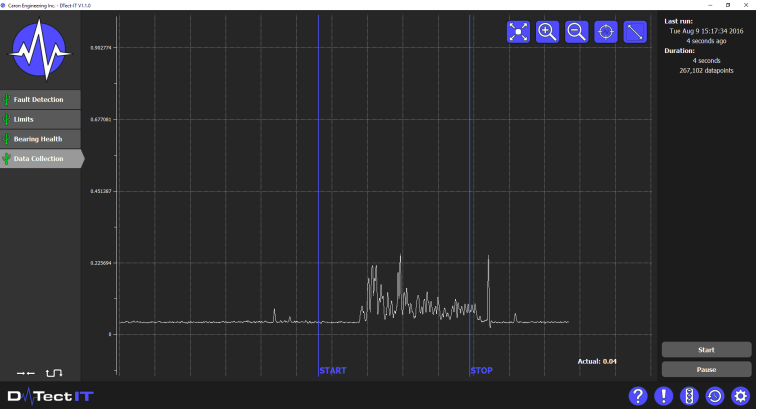
The Data Collection Analysis user interface provides a live graph that displays filtered signal data over time. The data read from the selected sensor is graphed using the data filter selected in the sensor settings. The user can interact with the live graph by utilizing the various zoom buttons on the graph.
Note: The signal in the live graph is filtered, but the data collected during the data collection is not.
On the right-hand side of the user interface there is an information panel that displays data about the last Data Collection analysis. The following information is displayed:
- Last Run: Displays the date and time of the last time the analysis was run. Also displays the amount of time that has passed since that run.
- Duration: how long data was collected for during the last run. Also displays the number of data points collected.
In addition to the information displayed, the following buttons are available at the bottom of the information panel:
- Start: Press to begin data collection. The analysis can also be started using a CNC command or physical I/O.
- Stop: Press to stop data collection. This button is only visible after data collection is started. The analysis can also be stopped using a CNC command or physical I/O.
- Pause: Disables the sensor and live graph. Use this when not utilizing the analysis. This button is replaced by the Resume button after it is pressed. To reactivate the live graph press the Resume button.
Running Data Collection
To begin collecting data from the selected sensor, press the Start button. DTectIT will collect all of the data from all channels of the selected sensor until the Stop button is pressed. Once the Stop button is pressed, the data collected will be written to a file based on the analysis' data logging settings. When collecting data, a status wheel is displayed in the information panel on the right.
Vertical lines labeled "START" and "STOP" will mark the beginning and end of the data collection on the live graph.
Data Collection Settings
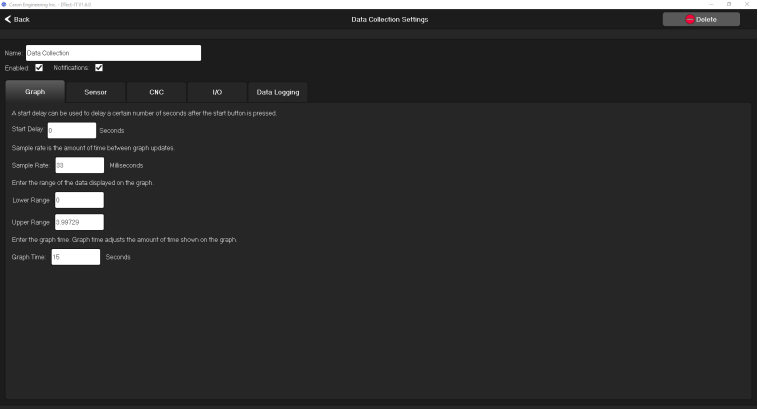
In the Data Collection settings menu, the following parameters can be programmed no matter which tab is open:
- Name: Change the analysis name in this field.
- Enabled: Enables or disables the analysis. Disabling the analysis will remove it from the list of analyses in the main user interface, but will not delete the analysis.
- Notifications: Enables or disables notifications for the analysis. Disabling notifications prevents notifications for the analysis from being stored in the Notification Center.
Graph Tab
The following parameters can be set in the Graph Tab:
- Start Delay: Delays the start of the analysis by a set number of seconds. If the start button is pressed the analysis will start after the programmed amount of time has passed.
- Sample Rate: The rate that DTect-IT plots data on the live graph. The minimum programmable sample rate is 1 ms.
- Upper and Lower Ranges: Sets the range of the live graph in the main interface. Program an upper and lower range that displays data in a desirable resolution.
- Graph Time: This field sets the amount of time displayed on the live graph. The default value is 15 seconds and the minimum graph time is 5 seconds.
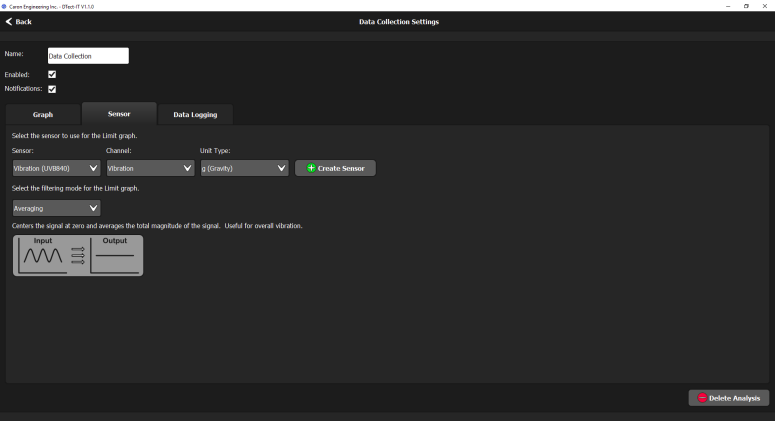
Sensor Tab
The following parameters can be set in the Sensor Tab:
- Sensor: Choose the Sensor to be utilized by the analysis, or create a new sensor using the Create Sensor button.
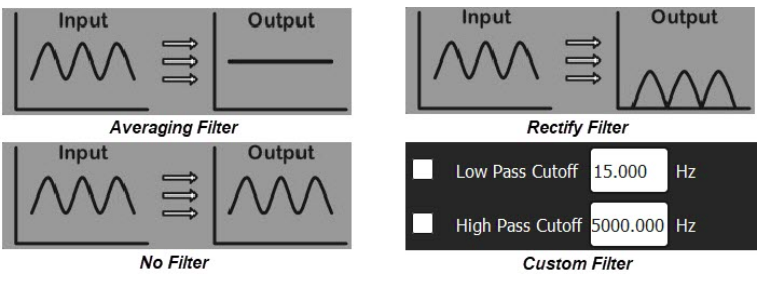
- Filtering mode: Select a data filter from the drop-down list. The following filters are available:
- Averaging Filter: Centers the signal at zero and averages the total magnitude of the signal. This filter is useful for overall vibration.
- Rectify Peaks Filter: Centers the signal at zero and shows the absolute value of the signal. Useful for looking for high peaks in any direction.
- No Filter: Displays raw signal data.
- Custom Filter: Creates a custom filter by allowing the user to set low pass and/or a high pass cutoff frequencies to be applied to the signal. Check the box(es) to enable one or both of the cutoff frequencies. Then set the frequency(Hz) in the field to the right for each frequency cutoff enabled.
CNC Tab
The following parameters can be set in the CNC Configuration tab:
- Device: Select a CNC from the drop-down menu. If a CNC has not been created, use the create button to open the wizard for the desired CNC.
- Commands Enabled: Check the box to enable communication between the analysis and the specified CNC device.
- Command ID: The integer value used to send commands from the CNC to the analysis.
CNC Commands and Command Returns
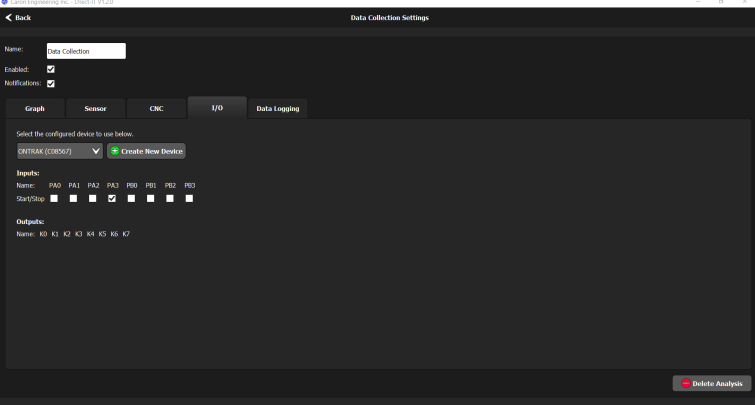
I/O Tab
The following parameters can be set in the I/O tab:
- Device: Assign an I/O device to the analysis. If one has not been created yet, one can be created using the Create New Device button.
- Inputs: Assign analysis features to specific inputs. When the Inputs are toggled, the analysis feature mapped to the input is activated. The following features can be mapped to inputs for data collection:
- Start/Stop: When this feature is mapped to an input and the input is turned on, the analysis will start running. When turned off, the analysis will stop.
- Outputs: There are currently no features that can be mapped to outputs for Data Collection. Note: The I/O device must be configured and connected to a USB port on the PC that DTect-IT is installed for any I/O parameters to be accessed in DTect-IT.
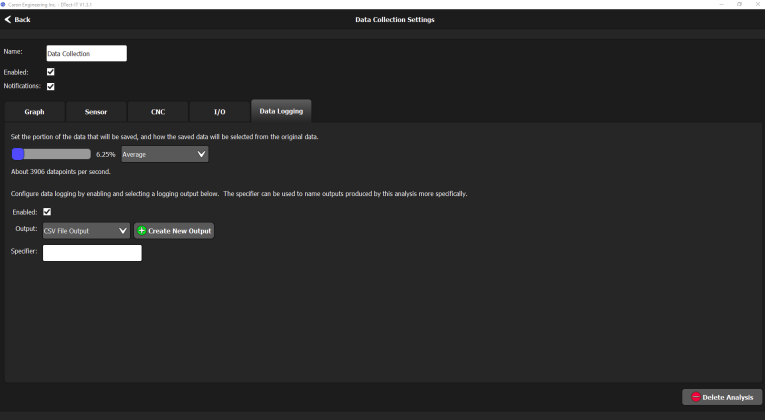
Data Logging Tab
The following parameters can be set in the Data Logging Tab:
- Slider Bar: Sets the percentage of data that should be saved. If left at 100 %, the Data Collection analysis collects all data from the selected sensor. Each data point saved uses 50 bytes of storage. At 62,500 data points a second (100%), about 3Mb of storage per second will be used. This can cause very large data files. At the minimum amount of data points, 3906 data points per second (6.25%), about 0.2 Mb of storage per second will be used. After selecting a percentage of data, the way DTect-IT saves data can be chosen from the drop down menu. The following choices are available:
- Average: Averages a group of data points based on the sample rate and percentage chosen and saves the average.
- Maximum: Saves the highest positive value from the set percentage of data points.
- Enabled: Enables data logging for the analysis.
- Output: Specify the type of data file output. If an output has not been created yet, one can be created using the create button.
- Specifier: A specifier is added to the file naming convention when log files are generated for the analysis. This allows the data files for specific analyses to be organized separately from the normal naming convention.

