No edit summary |
(typo) |
||
| Line 1: | Line 1: | ||
[[Category: | [[Category:DTect-IT]] | ||
[[Detect-IT|Back to | [[Detect-IT|Back to DTect-IT Home Page]] | ||
== '''Signature Analysis Wizard''' == | == '''Signature Analysis Wizard''' == | ||
Latest revision as of 11:37, 11 January 2023
Signature Analysis Wizard
Analysis Wizard The Signature Analysis wizard eases the setup of a Signature Analysis by guiding the user through the settings step by step. To set up a new Signature Analysis, click the Create button in the General Settings menu and select Signature. This launches the Signature Analysis Wizard. Perform the following steps in the wizard to create the analysis:
- Press Begin.
- Select or Create a new sensor for the analysis to utilize.
- Select a Channel and Unit Type from the drop down menu.
- Select a filtering mode.
- Enter a name for the analysis and Press Finish.
After finishing the analysis, the Signature analysis settings menu will be opened.
Signature Analysis User Interface
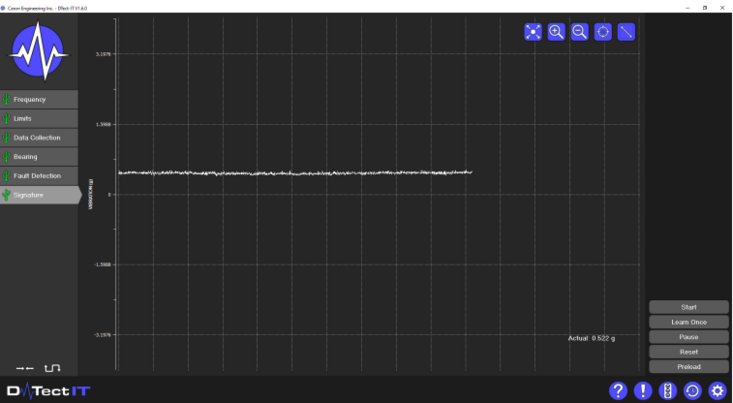
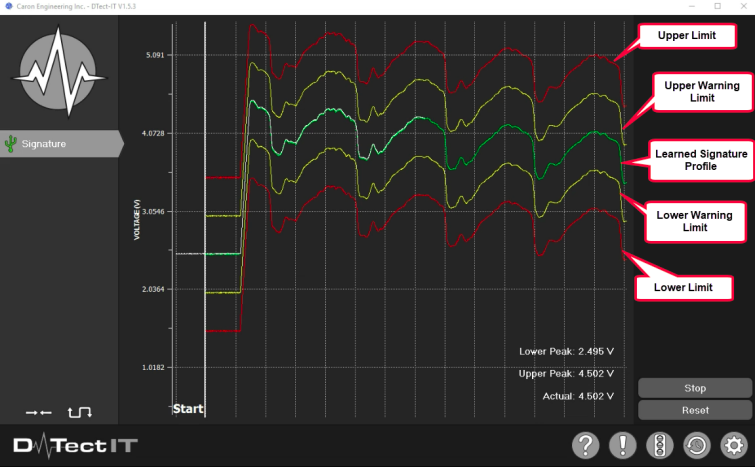
The Signature Analysis user interface displays one live graph for monitoring data in real time. When running a signature analysis, DTect-IT tests the measured data against user programmed limits that are based on a learned signature profile. An alarm is triggered when the signal value exceeds an upper limit or falls below a lower limit. The following buttons and features are available in the Signature Analysis user interface:
- Start/Stop: Press to start/stop a Signature analysis. The analysis can also be started or stopped using a CNC command or physical I/O.
- Learn Once: Flags the Learn once feature which forces DTect-IT into learn mode on the next analysis start. In learn mode, DTect-IT records a signature profile of the signal value for which signature limits are based.
- Pause: Disables the live graph and sensor. Use this when not utilizing the analysis.
- Reset: Resets the live graph and clears any active alarms
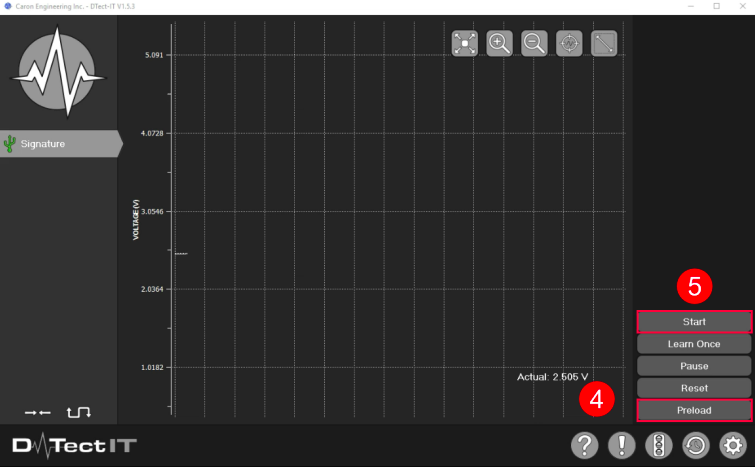
- Preload: Loads the learned signature profile from the last learn operation. The learned signature profile must be preloaded prior to starting a signature analysis.
Performing a Signature Analysis
Signature analysis monitors a sensor signal using limits that mirror the sensor signal. Learning the signature profile of the monitored process provides DTect-IT with the necessary data to create these limits. Use the following steps as a guide to set up and perform a signature analysis:
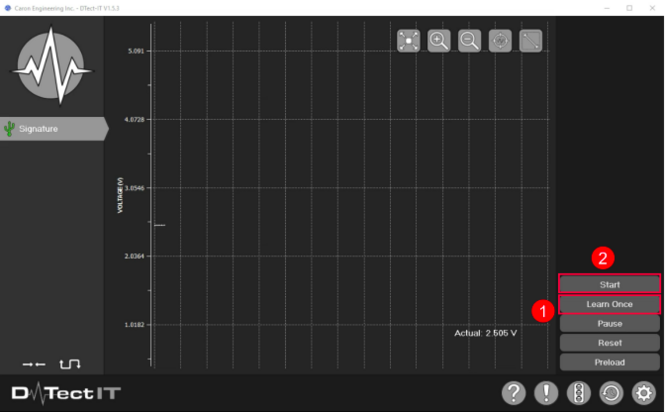
- Press the Learn Once button
- Start the machining process that needs to be learned and start the analysis. The analysis can be started using the Start button on the user interface.
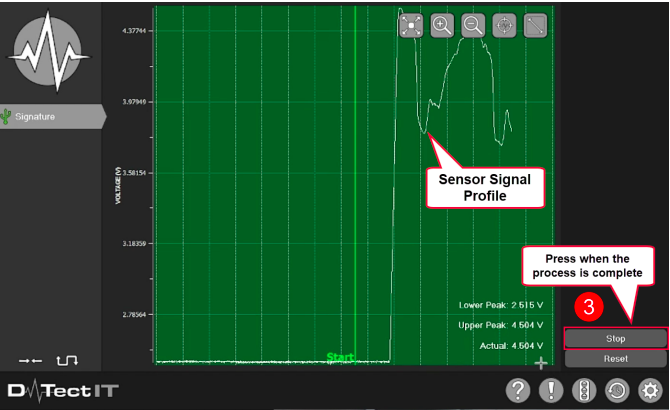
- While in learn mode, DTect-IT will record the sensor signal data for the entire process. When the process is complete, stop the analysis using the Stop button on the user interface.
- Once the signature profile is learned, press the Preload button. This allows DTect-IT to access the learned signature profile data to build limits for monitoring.
- Start the analysis by pressing the Start button.
Once the analysis starts, DTect-IT monitors the sensor signal based on the learned signature profile. If the sensor signal deviates significantly from the learned signature profile an alarm condition is triggered.
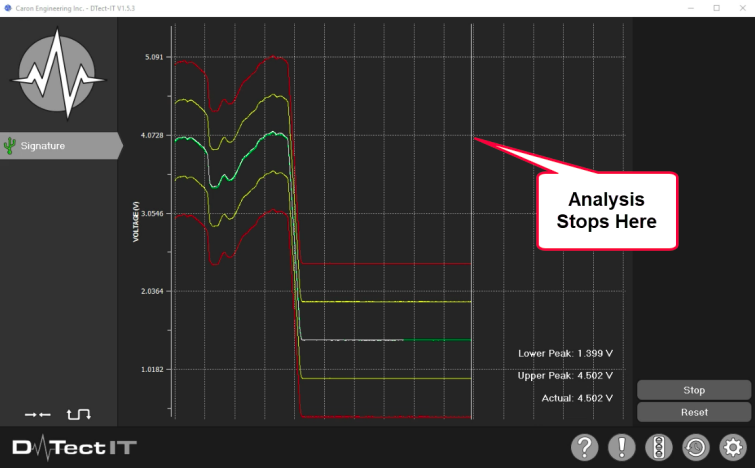
Due to the nature of how DTect-IT creates the learned signature profile, the signature analysis will stop automatically when the process reaches the last data point of the learned signature profile.
Limit Types for Signature Analysis
Limit types change how the signature analysis triggers an alarm condition based on the signal value. The following Limit types are available:
- Running: An alarm occurs when the sensor signal value:
- exceeds the Upper or Upper warning limit values
- falls below the lower warning or lower limit values
The Signature analysis remains in alarm until the alarm condition is no longer satisfied (e.g. the sensor signal value falls below the set upper warning limit value).
- Latching: An alarm condition is triggered in the same manner as a running limit type, but the limit analysis remains in alarm until the analysis is reset. Latching limit type is available for upper, warning and lower limits.
The behavior of running and latching alarms for signature analysis is the same as limit analysis.
Signature Analysis Settings
In the Signature Analysis settings menu, the following parameters can be programmed no matter which tab is open:
- Name: Change the analysis name in this field.
- Enabled: Enables or disables the analysis. Disabling the analysis will remove it from the list of analyses in the main user interface, but will not delete the analysis.
- Notifications: Enables or disables notifications for the analysis. Disabling notifications prevents notifications for the analysis from being stored in the Notification Center.
- Enable Run Count: Enables a run count for the analysis. Increments by one every time the analysis is run, start to stop. The current run count is displayed in the analysis settings menu and on the live graph.
- Reset Run Count: Resets the current run count back to zero.
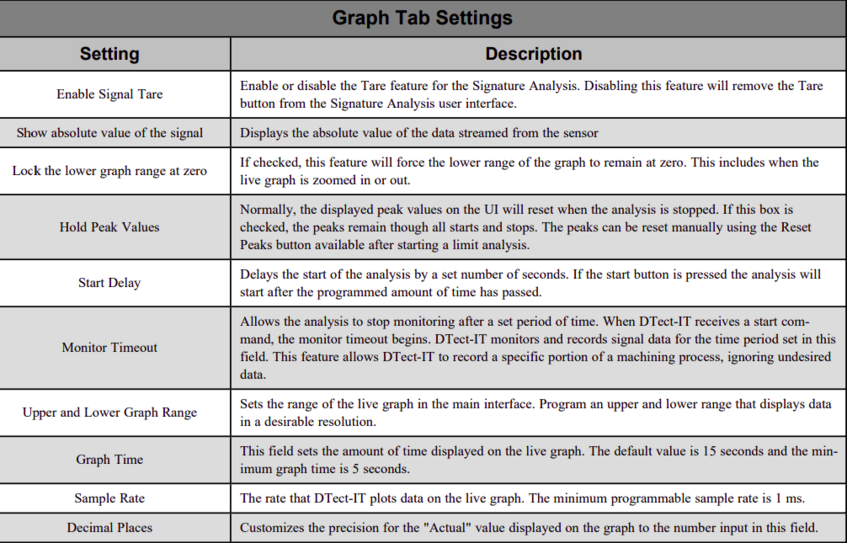
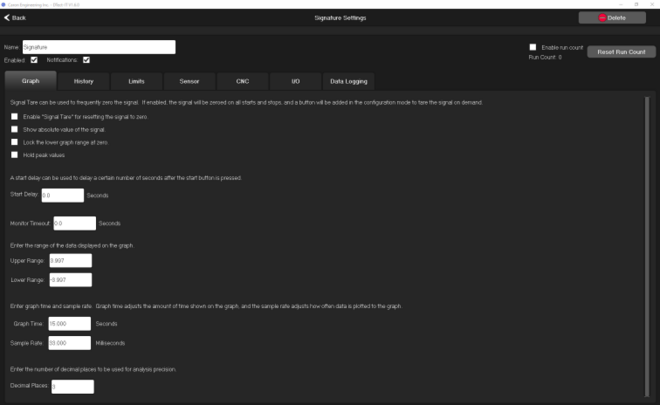
Graph Tab
The following table displays the graph tab settings for Signature Analysis:
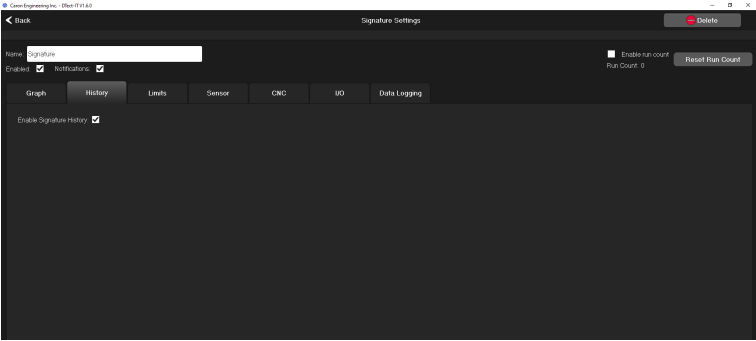
History Tab
The following parameters can be set in the History tab:
- Enable Limit History: Enables the History View page for the analysis.
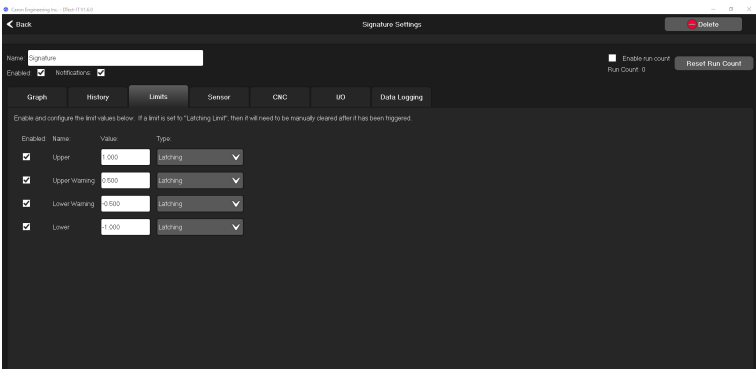
Limit Tab
The following parameters can be set in the Limits tab:
- Enable/Disable Limits: The check-boxes next to each limit determine if a limit is enabled or disabled. By default each limit is enabled. When a limit is disabled, the limit will not be displayed on the live graph.
- Upper: The value in this field is the value that the measured data must exceed to trigger an upper alarm .
- Upper Warning: The value in this field is the value that the measured data must exceed to trigger an upper warning alarm .
- Lower Warning: The value in this field is the value that the measured data must fall below to trigger a lower warning alarm .
- Lower: The value in this field is the value that the measured data must exceed to trigger a lower alarm.
- Limit Type: See above section
Sensor Tab
The following parameters can be set in the Sensor Tab:
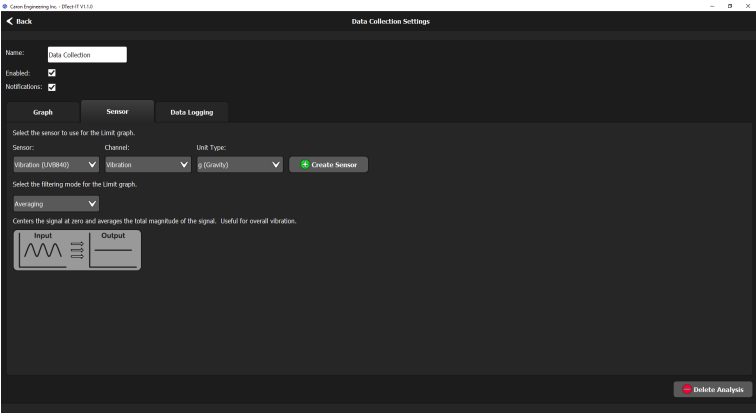
- Sensor: Choose the Sensor to be utilized by the analysis, or create a new sensor using the Create Sensor button.
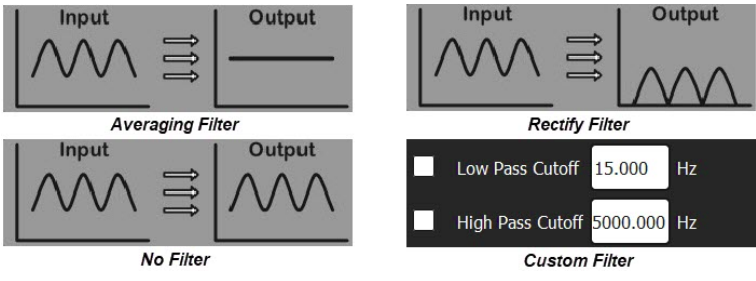
- Filtering mode: Select a data filter from the drop-down list. The following filters are available:
- Averaging Filter: Centers the signal at zero and averages the total magnitude of the signal. This filter is useful for overall vibration.
- Rectify Peaks Filter: Centers the signal at zero and shows the absolute value of the signal. Useful for looking for high peaks in any direction.
- No Filter: Displays raw signal data.
- Custom Filter: Creates a custom filter by allowing the user to set low pass and/or a high pass cutoff frequencies to be applied to the signal. Check the box(es) to enable one or both of the cutoff frequencies. Then set the frequency(Hz) in the field to the right for each frequency cutoff enabled.
CNC Tab
The following parameters can be set in the CNC Configuration tab:
- Device: Select a CNC from the drop-down menu. If a CNC has not been created, use the create button to open the wizard for the desired CNC.
- Commands Enabled: Check the box to enable communication between the analysis and the specified CNC device.
- Parameters Enabled: When enabled, DTect-IT allocates an additional variable (subsequent to the command variable) that provides additional data based on the sensor chosen for the analysis.
- Enable analysis specific variables and source: Press the check boxes to enable more analysis specific information to be written to the CNC. Select which register and variable DTect-IT should use when writing data to the CNC. The following can be enabled for :
- Acknowledge: The acknowledge register is populated with the corresponding value when the analysis is started or stopped.
- Alarm: Writes the alarm status of the analysis to the specified variable.
- Graph Value: Writes the currently monitored graph value to the specified variable.
- Lower Peak Value: Writes the lowest recorded value to the specified variable.
- Upper Peak Value: Writes the highest recorded value to the specified variable.
- Run Count Value: Writes the recorded run count to the specified variable.
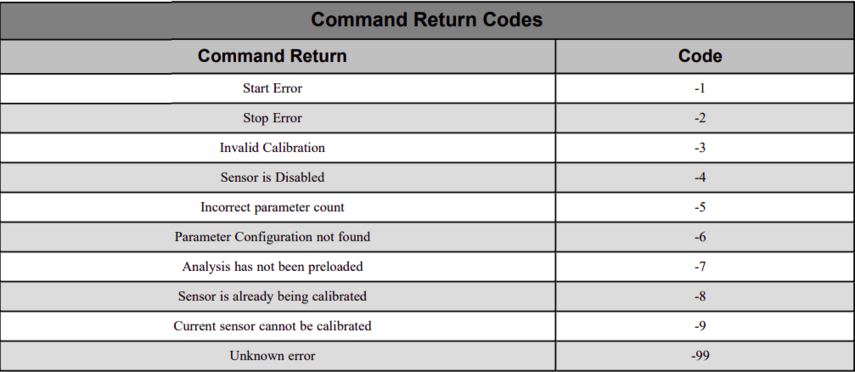
Alarm and Command Codes for Signature Analysis
CNC Commands and Command Returns
IO Tab
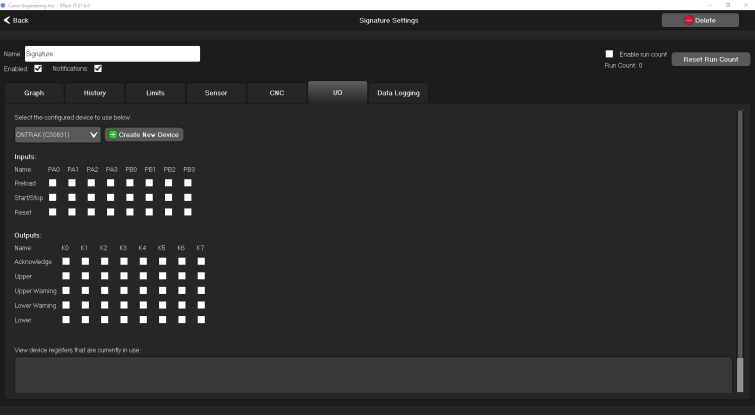
The following parameters can be set in the I/O tab:
- Device: Assign an I/O device to the analysis. If one has not been created yet, one can be created using the Create New Device button.
- Inputs: Assign analysis features to specific inputs. When the Inputs are toggled, the analysis feature mapped to the input is activated. The following features can be mapped to inputs for :
- Preload: When the input is turned on, the preload feature is enabled. The preload input must be turned on before the Start input
- Start/Stop: When this feature is mapped to an input and the input is turned on, the analysis will start running. When turned off, the analysis will stop.
- Reset: This feature is used in conjunction with latching limits. If a limit latches, the input mapped to this feature can be pulsed to reset the alarm condition for the analysis.
- Outputs:
- Acknowledge: The acknowledge output bit turns on when the analysis is started and the bit turns off when the analysis is stopped.
- Upper: When an Upper alarm is triggered, the mapped output turns on.
- Upper Warning: When an Upper Warning alarm is triggered, the mapped output turns on.
- Lower Warning: When an Lower Warning alarm is triggered, the mapped output turns on.
- Lower: When an Lower alarm is triggered, the mapped output turns on.
Note: The I/O device must be configured and connected to a USB port on the PC that DTect-IT is installed for any I/O parameters to be accessed in DTect-IT.
Data Logging Tab
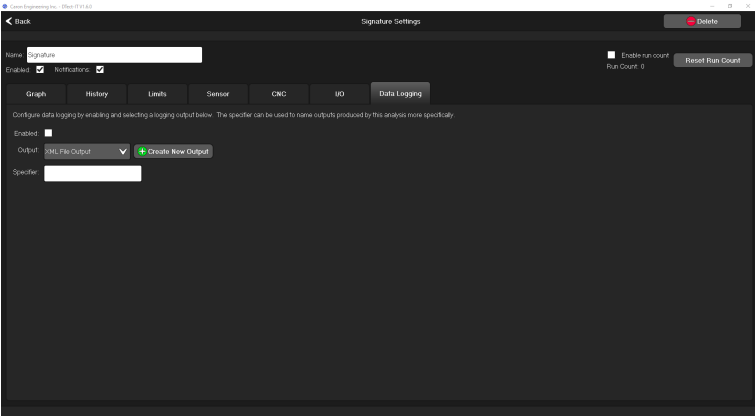
The following parameters can be set in the Data Logging Tab:
- Enabled: Enables data logging for the analysis.
- Output: Specify the type of data file output. If an output has not been created yet, one can be created using the create button.
- Specifier: A specifier is added to the file naming convention when log files are generated for the analysis. This allows the data files for specific analyses to be organized separately from the normal naming convention.
Signature Analysis History View
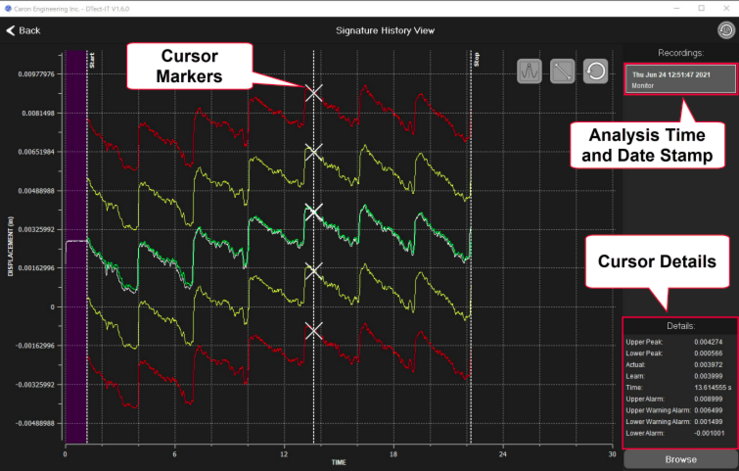
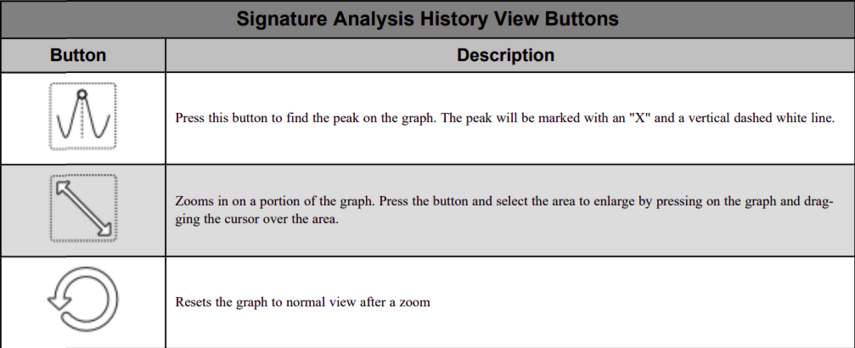
If Signature analysis is selected in the main user interface and History View is enabled in the settings, pressing the History View button will open a screen displaying the most recent recording of the signature analysis. Clicking on the graph places a cursor that provides additional details at cursor location. The cursor is marked with a vertical white line and an "X" where it intersects each limit, the sensor signal, and the learned signature profile
The horizontal scroll bar allows quick selection of a specific time in the recording to review magnitude and frequency data. Alternatively, the Previous and Next buttons may be used to incrementally step through various times in the recording.
Signature History Selection
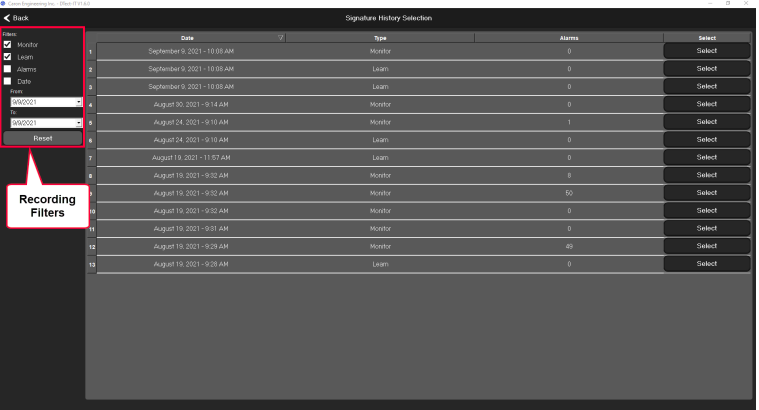
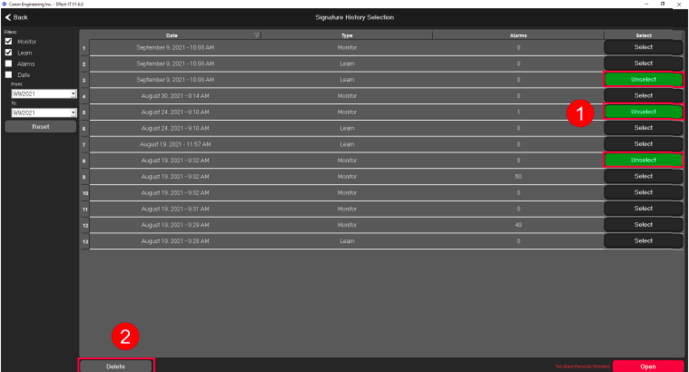
Press the BROWSE button in the history view to open a list of all recordings of the signature analysis. Each recording listed displays the date and time of the analysis, type of recording, and the number of alarms that occurred. The list of recordings can be filtered using the filter options on the left side of the window. Recordings can be filtered by the following:
- Monitor: Check to display all monitor type recordings
- Learn: Check to display all learn type recordings
- Alarms: Check to display only recordings that contain alarms
- Date: Enter a date range using the drop-down menus. Only recordings within the selected range are displayed.
Any combination of filters may be used to filter the list.
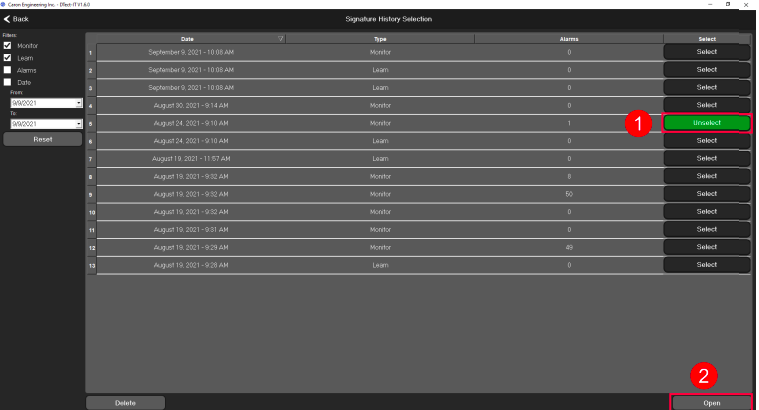
Opening Signature Recordings
Use the following steps to open a signature recording:
- Select a recording from the list
- Press the Open button
Deleting Signature History Results
Use the following steps to delete signature recordings
- Select a recording(s) from the list
- Press the Delete button
- Press YES
