m (Text replacement - "Return to DTect-IT Main Page" to "Category:DTect-IT Return to DTect-IT Main Page") |
|||
| (One intermediate revision by one other user not shown) | |||
| Line 1: | Line 1: | ||
[[ | [[Category:DTect-IT]] | ||
[[DTect-IT|Return to DTect-IT Main Page]] | |||
== '''Overview''' == | == '''Overview''' == | ||
Latest revision as of 12:39, 11 January 2023
Overview
DTect-IT is capable of performing a bearing analysis on machine bearings. DTect-IT utilizes a vibration sensor, attached to the housing of the monitored machine bearings, to perform an acceleration and velocity analysis on the vibration signal. The analysis diagnoses bearing health and other bearing issues.
Bearing Analysis Wizard
The Bearing Analysis wizard eases the setup of a Bearing Analysis by guiding the user through the settings step by step. To set up a new Bearing Analysis, click the Create button in the General Settings menu and select Bearing. This launches the Bearing Analysis Wizard. Perform the following steps in the wizard to create the analysis:
- Press Begin.
- Select or Create a new sensor for the analysis to utilize.
- Note: Only vibration sensors can be used with Bearing Analysis. If DTect-IT has other sensors connected, only vibration sensors will appear in the drop down menu. Once a sensor is selected the Channel and Units types field are populated automatically and cannot be changed.
- Enable or Disable Bearing Analysis History Enabling this allows access to the History view of Bearing analysis in DTect-IT. This feature is enabled by default and can be disabled in the settings menu.
- Enter a name for the analysis and Press Finish. After finishing the analysis, the Bearing analysis settings menu will be opened.
Bearing Analysis User Interface
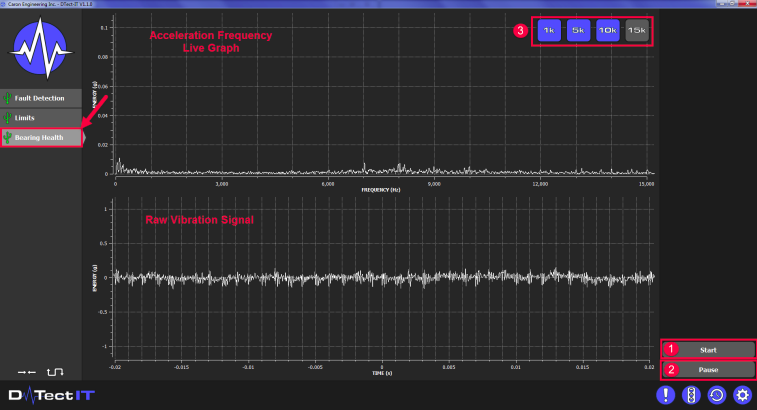
The Bearing Analysis user interface displays two live graphs. The top graph displays acceleration energy (g) versus frequency (Hz) and the bottom graph displays the raw vibration signal over time. The following buttons are available in a bearing analysis:
- Start: Press to begin a bearing health analysis. The analysis can also be started using a CNC command or physical I/O. (1)
- Cancel: Cancels an analysis that has been started.
- Pause: Disables the live graphs and sensor. Use this when not utilizing the analysis. (2)
- Frequency Buttons: Adjusts the viewable frequency range of the acceleration live graph. Available ranges are 1k, 5k, 10k and 15k Hz. (3)
Performing a Bearing Analysis
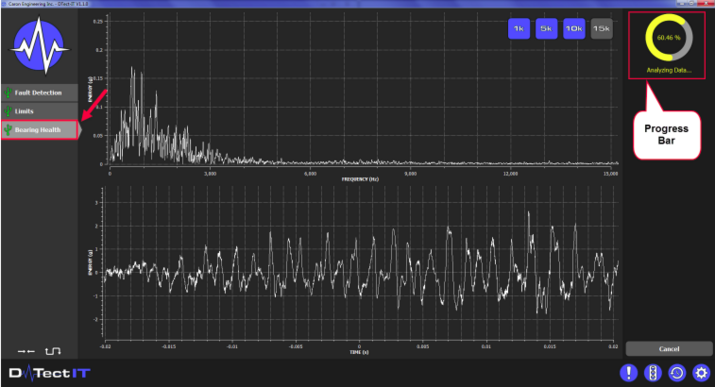
To perform a bearing analysis, select the desired bearing analysis tab from the list of analyses. This will display the bearing analysis in the main interface. A bearing analysis should be performed when a machine is running at max RPM and is not engaged in cutting. Bearing analysis also requires a balanced tool in the spindle. CEI recommends using a hydraulic clamp or shrink fit tool. Press the start button to begin the analysis. As DTect-IT performs the bearing analysis, a progress bar will fill up in the user interface displaying the completion percentage of the analysis.
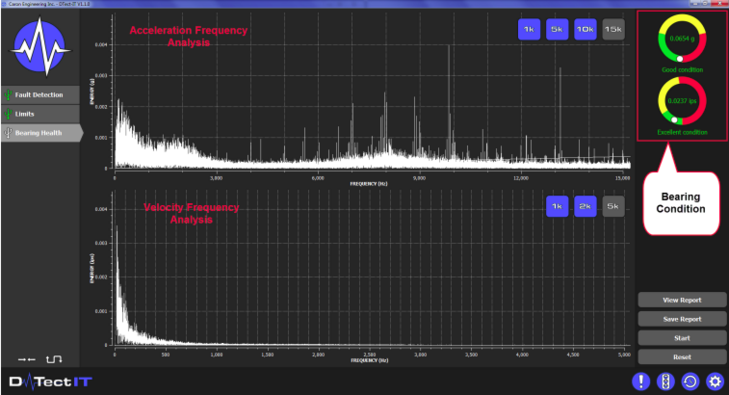
Once the analysis is complete, the results of the analysis will be displayed in the user interface. The acceleration analysis will determine the bearing health and the velocity analysis will determine if there are other underlying issues. These issues could be rolling bearing failure, bearing imbalance, misalignment or other issues. DTect-IT does not diagnose the specific problem, but it does provide the user with the data to have the issue examined more closely.
Bearing Analysis Results
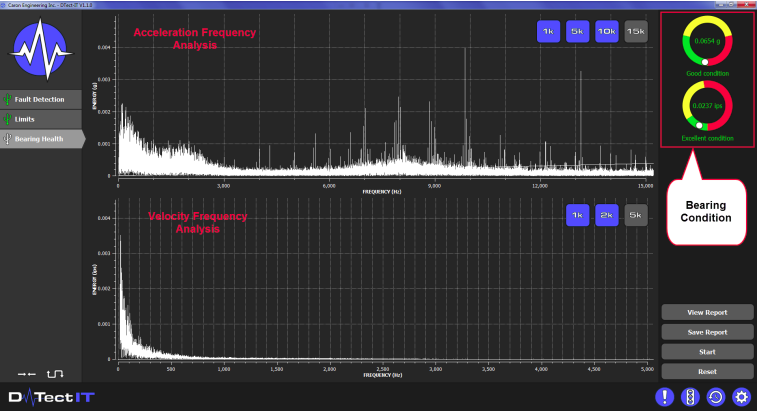
Once a bearing analysis is complete, the live graphs are replaced by the acceleration and velocity energy results. Two status bars on the right of the interface display the condition of the bearing. The RMS value is displayed in the middle of the status bar and the condition is stated below the status bar. The graphs will change color based on the conditions of the machine bearing.
The following buttons are available in the interface after completing a bearing analysis:
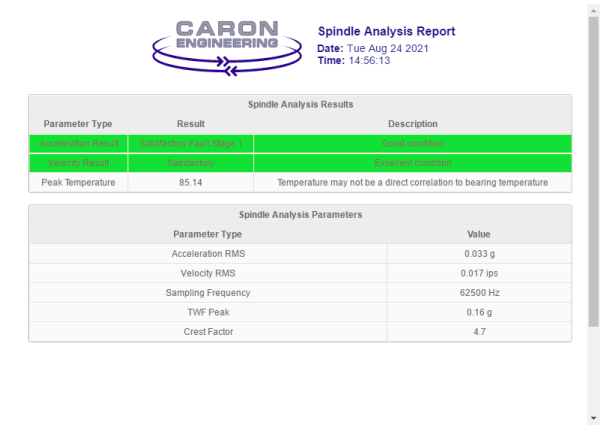
- View Report: Opens a preview of the bearing analysis report.
- Save Report: Saves a copy of the bearing analysis report to the directory specified in the settings. This can be set to save automatically.
- Frequency Buttons: Change the frequency range on the result graphs. Available ranges are 1k, 5k, 10k and 15k Hz for acceleration and 1k, 2k, and 5k for velocity.
- Start: Starts a new bearing analysis.
- Reset: Resets the interface to default.
Note: The frequency analysis graphs will not change color if the bearing is in good or excellent condition.
Status Icons
In the analysis tab for a bearing analysis, icons will appear based on the alarm status of the analysis. When the analysis is run and an unsatisfactory or worse result occurs, an icon will appear in the analysis tab.
Bearing Analysis Settings Menu
In the Bearing AnalysisSignature Analysis settings menu, the following parameters can be programmed no matter which tab is open:
- Name: Change the analysis name in this field.
- Enabled: Enables or disables the analysis. Disabling the analysis will remove it from the list of analyses in the main user interface, but will not delete the analysis.
- Notifications: Enables or disables notifications for the analysis. Disabling notifications prevents notifications for the analysis from being stored in the Notification Center.
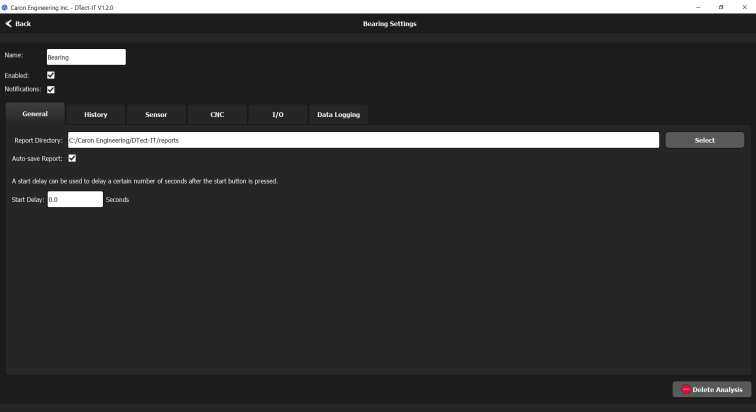
General Tab
The following parameters can be set in the General tab:
- Report Directory: Press the Select button to choose where bearing analysis reports will be saved.
- AutoSave Reports: If Autosave Reports is enabled, a report will be automatically saved every time a bearing analysis is run.
- Start Delay: Delays the start of the analysis by a set number of seconds. If the start button is pressed or if a start command is sent from the CNC or physical I/O, the analysis will start after the programmed amount of time has passed.
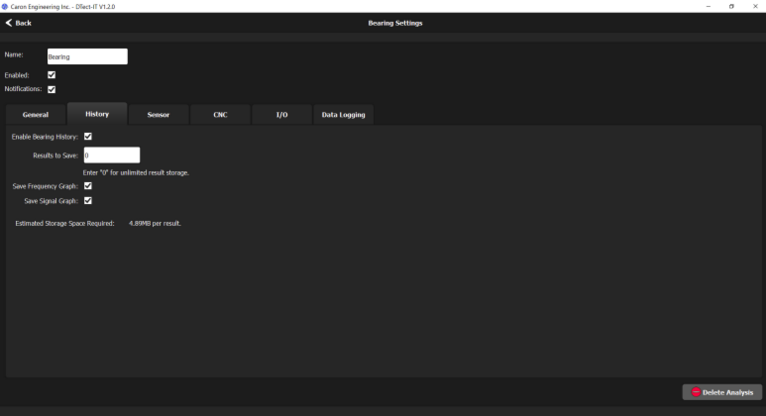
History Tab
The following parameters can be set in the History tab:
- Enable Bearing History: Enables the History View page for the analysis.
- Results to Save: Sets the number of Bearing Analysis results that DTectIT will save. After the programmed number of results is reached, any additional analysis results will replace the oldest analysis result. Enter "0" for unlimited result storage.
- Save Frequency Graph: Check to save the acceleration and velocity frequency graphs for the History View page.
- Save Signal Graph: Check to save the signal graph for the History View page.
After all history settings are programmed, the total storage space required to store the results is calculated and displayed. If unlimited storage is chosen, the storage space required will be displayed per result.
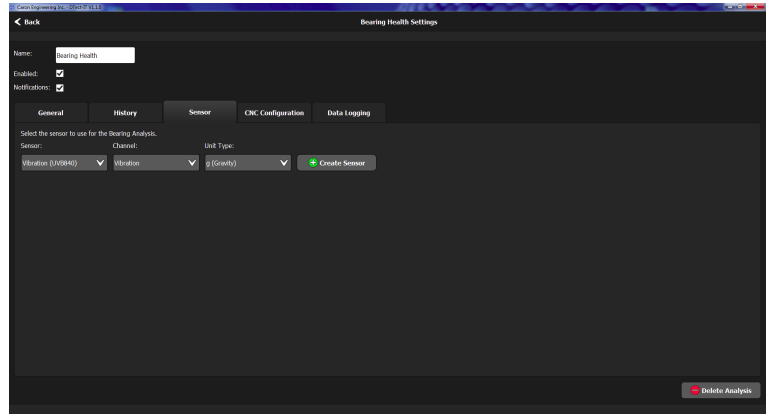
Sensor Tab
The following parameters can be set in the Sensor Tab:
- Sensor: Choose the Sensor to be utilized by the analysis, or create a new sensor using the Create Sensor button.
Note: Only vibration sensors can be used with Bearing Analysis. If DTect-IT has other sensors connected, only vibration sensors will appear in the drop-down menu. Once a sensor is selected the Channel and Units type fields are populated automatically and cannot be changed.
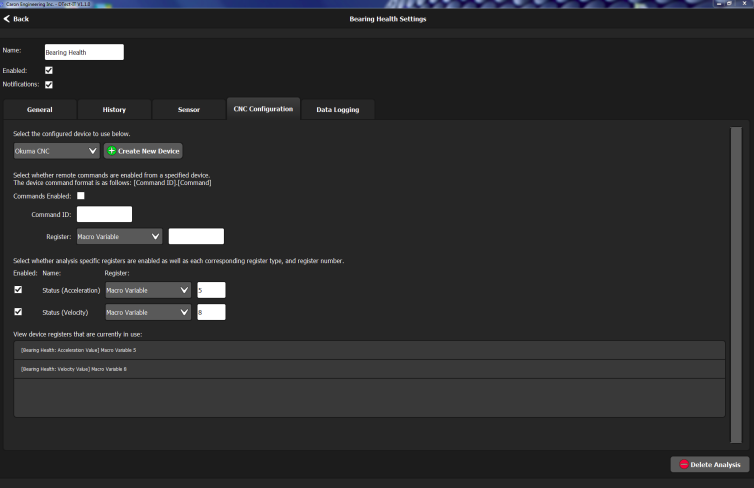
CNC Tab
The following parameters can be set in the CNC Configuration tab:
- Device: Select a CNC from the drop-down menu. If a CNC has not been created, use the create button to open the wizard for the desired CNC.
- Commands Enabled: Check the box to enable communication between the analysis and the specified CNC device.
- Command ID: The integer value used to send commands from the CNC to the analysis.
- Register: Specify the register type and a variable to send CNC commands through. The device registers and I/O in use by DTect-IT can be viewed in the field at the bottom of this tab.
- Enable analysis specific variables and source: Press the check boxes to enable more analysis specific information to be written to the CNC. Select which register and variable DTect-IT should use when writing data to the CNC. The following can be enabled for bearing analysis:
- Acknowledge: The acknowledge register is populated with the corresponding value when the analysis is started or stopped.
- Status (Acceleration): Writes the bearing analysis acceleration results to the specified variable.
- Status (Velocity): Writes the velocity RMS value to the specified variable.
Alarm and Command Codes for Bearing Analysis
CNC Commands and Command Returns
I/O Tab
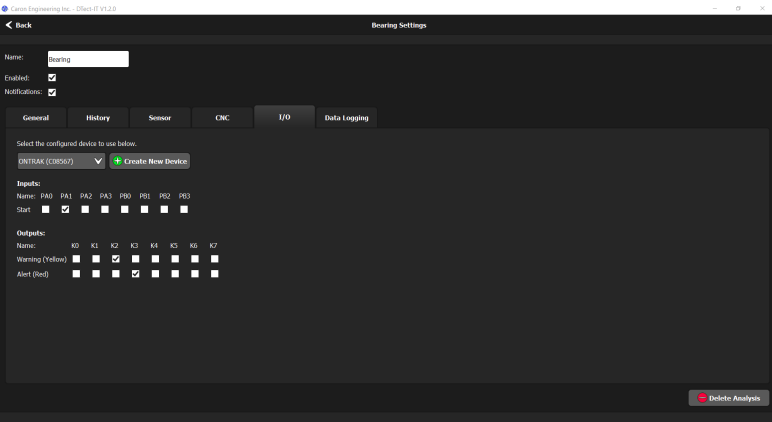
The following parameters can be set in the I/O tab:
- Device: Assign an I/O device to the analysis. If one has not been created yet, one can be created using the Create New Device button.
- Inputs: Assign analysis features to specific inputs. When the Inputs are toggled, the analysis feature mapped to the input is activated. The following features can be mapped to inputs for bearing analysis:
- Start: When this feature is mapped to an input and the input is turned on, the analysis will start.
- Outputs: Assign analysis features to specific outputs. The following features can be mapped to outputs for bearing analysis:
- Acknowledge: The acknowledge output bit turns on when the analysis is started and the bit turns off when the analysis is stopped.
- Warning(Yellow): When a bearing analysis returns a Warning condition, the mapped output turns on.
- Alert (Red): When a bearing analysis returns an Alert condition, the mapped output turns on. Note: The I/O device must be configured and connected to a USB port on the PC that DTect-IT is installed for any I/O parameters to be accessed in DTect-IT.
Note: The I/O device must be configured and connected to a USB port on the PC that DTect-IT is installed for any I/O parameters to be accessed in DTect-IT.
Data Logging Tab
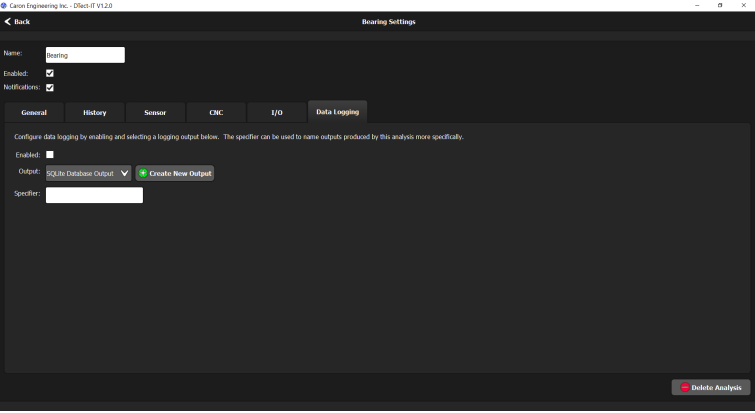
The following parameters can be set in the Data Logging Tab:
- Enabled: Enables data logging for the analysis.
- Output: Specify the type of data file output. If an output has not been created yet, one can be created using the create button.
- Specifier: A specifier is added to the file naming convention when log files are generated for the analysis. This allows the data files for specific analyses to be organized separately from the normal naming convention.
- Detailed Output: Adds dates and time stamps to outputs
Bearing Analysis History View
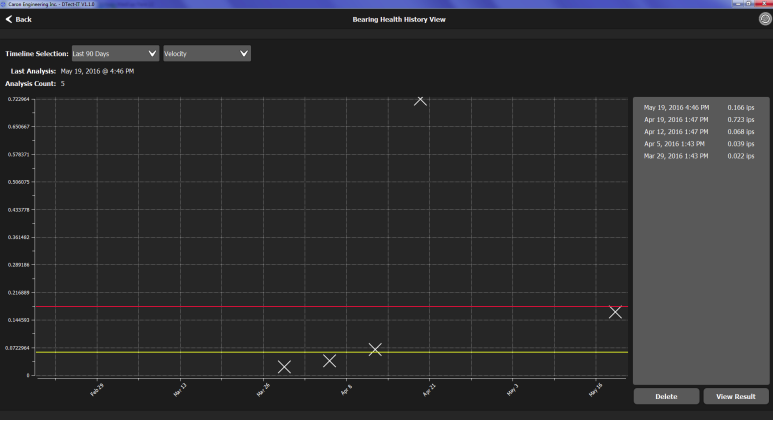
If a bearing health analysis is selected in the main user interface and History View is enabled in the settings, pressing the History View button will open a screen displaying a record of bearing health analyses.
If History View is enabled, each time a bearing analysis is run it is recorded by DTect-IT. In the History view screen, the analyses are graphed in RMS value versus date of analysis. Each analysis is marked on the graph with an "X" and is also listed on the right of the screen. The yellow and red lines represent the RMS values that cause unsatisfactory or unacceptable fault stages.
Using the drop-down menus filters the data displayed on the graph. The data can be viewed by acceleration or velocity analysis, and analyses can be viewed from the last week to all time.
Note: Due to a redesign of the database structure, all historical data will not be backwards compatible with any existing 1.5.x and below versions of DTect-IT. It is recommended all old data is backed up after install of DTect-IT 1.6.0.
View Results Button
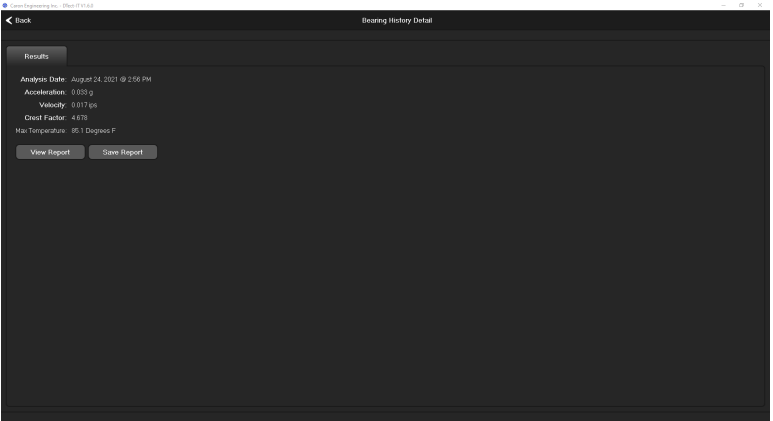
Selecting an analysis from the list allows the user to delete the analysis or view more detailed results. Pressing the View Result button opens a new window displaying the following information:
- Analysis Date
- Acceleration RMS Value
- Velocity RMS Value l Crest Factor
- Max Temperature Additionally, a bearing health report can be viewed or saved using the View Report and Save Report buttons, respectively.
Additionally, a bearing health report can be viewed or saved using the View Report and Save Report buttons, respectively.
