No edit summary |
No edit summary |
||
| (3 intermediate revisions by the same user not shown) | |||
| Line 1: | Line 1: | ||
[[Category:TMAC]] | [[Category:TMAC]] | ||
[[TMAC|Back to TMAC Home Page]] | |||
== '''Overview''' == | == '''Overview''' == | ||
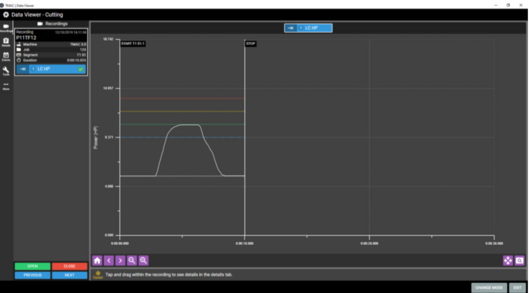
The TMAC Data Viewer is a diagnostics tool for analyzing historical data. The Data Viewer allows graphical viewing of TMAC recordings. Various tools are available in the Data Viewer to analyze data. The Data Viewer interface and functionality varies based on the mode of operation selected at launch. The following modes of operation are available: | |||
* Cutting Mode | |||
* Bearing Health | |||
* Millivolt Mode | |||
'''Note:''' The Change Mode button allows the user to switch between modes in the Data Viewer. | |||
== '''Data Viewer: Cutting and Millivolt Modes''' == | == '''Data Viewer: Cutting and Millivolt Modes''' == | ||
The interface and functionality of the Data Viewer are the same for Cutting Mode and Millivolt Mode. Minor differences occur in the units displayed on the recording and in the data reported in the Details Tab. | |||
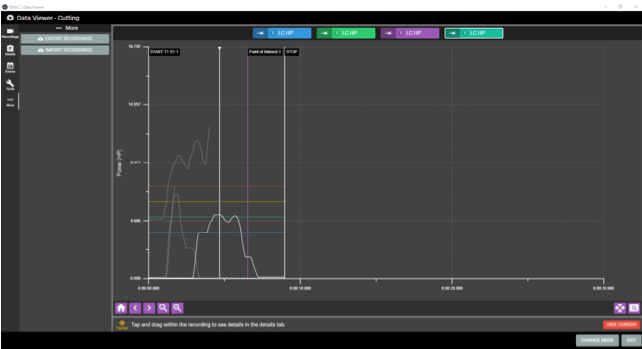
When Cutting Mode or Millivolt Mode is selected, the Data Viewer opens the most recent recording for the selected mode. The Data Viewer interface is split into two sections: A tool bar and a graphical display of the operation recording. The tool bar provides information about the operation and provides several tools for analyzing recordings. | |||
The Data Viewer tool bar has the following tabs: | |||
* Recordings | |||
* Details | |||
* Events | |||
* Tools | |||
[[File:Data Viewer - Cutting and Millivolt Modes.png|center|thumb|525x525px|Data Viewer - Cutting and Millivolt Modes ]] | |||
=== '''Recording Viewer''' === | === '''Recording Viewer''' === | ||
The Recording Viewer portion of the Data Viewer offers a graphical representation of the selected operation. The recording of the operation can be manipulated with a set of buttons available at the bottom of the Recording Viewer. | |||
[[File:Screen Shot 2022-08-31 at 1.14.45 PM.png|center|thumb|745x745px|Recording Viewer Button Functions]] | |||
=== '''Recording Tab''' === | === '''Recording Tab''' === | ||
The Recording tab is used to open recordings for viewing. Multiple recordings can be opened simultaneously. Open recordings are listed on the left of the recording viewer. Each open recording is represented by an information card that includes additional data. Any number of recording cards can be opened simultaneously. | |||
[[File:Recordings Tab.png|center|thumb|529x529px|Recordings Tab ]] | |||
==== '''''Recording Cards''''' ==== | ==== '''''Recording Cards''''' ==== | ||
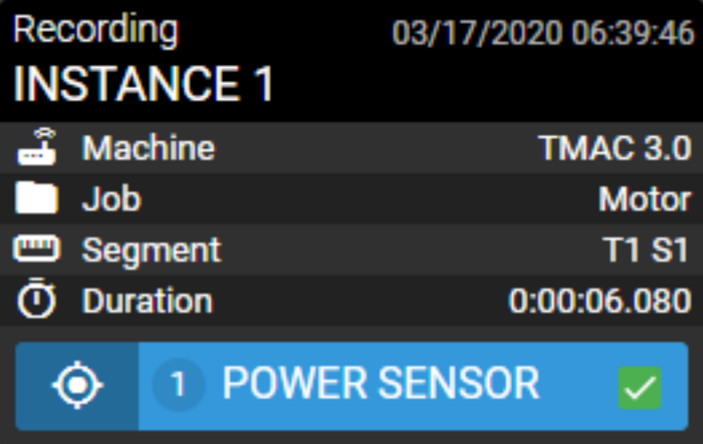
The recording cards display the following information about the recording: | |||
* Date and Time Stamp | |||
* Instance Name | |||
* Machine Name | |||
* Job Name (Cutting Mode only) | |||
* Segment Name (Operation) | |||
* Cut Duration | |||
* Channel Name | |||
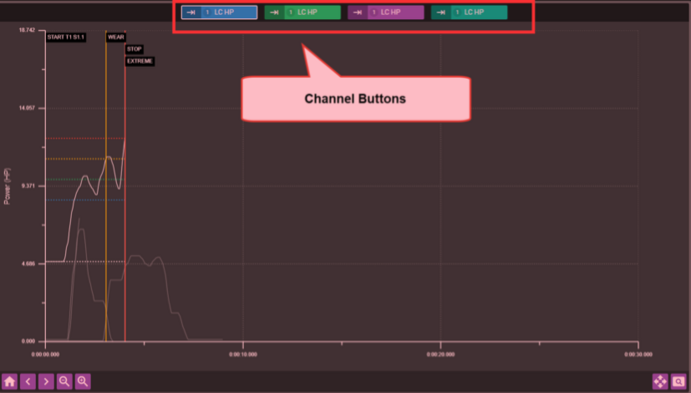
Each recording card has check-boxes for each channel associated with the recording. Marking these check-boxes adds a Channel button above the recording viewer for the associated channel. When multiple channel check-boxes are marked, the data for each channel overlays in the recording viewer. This allows for quick and easy comparisons of data. Up to four channels can be marked for comparison. | |||
[[File:Recording Card.png|center|thumb|703x703px|Recording Card ]] | |||
'''Note:''' Recording cards may have multiple channel check-boxes. This occurs when the recorded operation included a multichannel start. | |||
In addition to the recording cards displayed, there are buttons available that manipulate the list. | |||
[[File:Recording Card Button Descriptions.png|center|thumb|851x851px|Recording Card Button Descriptions ]] | |||
===== '''Opening a Recording Card''' ===== | |||
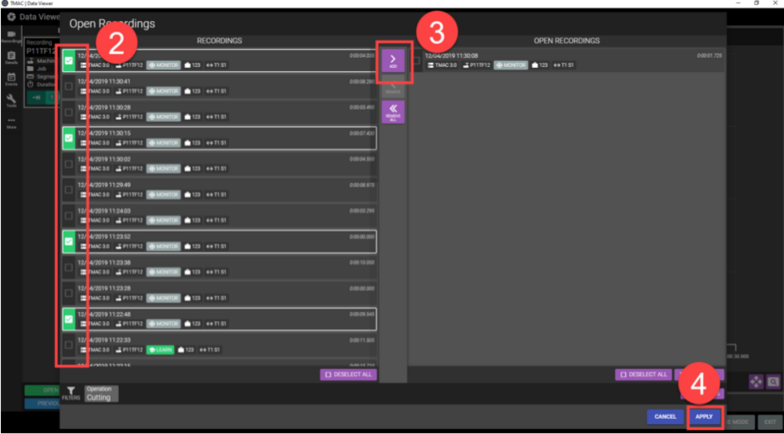
Clicking the OPEN button on the Recordings tab opens a window displaying a list of available recordings and a list of open recordings. This window offers a simple interface to open multiple recordings at once in the Data Viewer. To open recordings in the Data Viewer, use the following steps: | |||
# Click the OPEN button on the Recordings tab | |||
# Available recordings are on the left hand side of the window. Select the recording(s) to open by clicking the check-boxes next to the desired recordings. | |||
# Click the ADD button to move the selected recordings to the Open Recordings list. | |||
# Click APPLY to open the recordings in the Data Viewer | |||
[[File:Opening Recording Cards.png|center|thumb|784x784px|Opening Recording Cards ]] | |||
The selected recordings are added to the list of recordings in the Data Viewer and are available for viewing. | |||
===== '''Applying Recording Filters''' ===== | |||
The list of available recordings may be very large. Filters are available when selecting a recording to open. To access the recording filters, click the EDIT FILTERS button. The following filters are available: | |||
* Machine: Select from a list of machines names. Only recordings from the selected machine will be displayed | |||
* Instance: Select from a list of instances. Only recordings from the selected instance will be displayed | |||
* Time Range: Select from a list of preset time frames or set a custom time frame. A custom time frame is defined by the user by specifying a date and time for the start and end of the time range. Only recordings within the selected time frame will be viewable in the list of recordings. | |||
* Alarm: Filter recordings by alarm type. Only recordings containing the selected alarm condition are displayed. Selecting No Alarm displays only recordings without alarm conditions. | |||
* Monitor mode: Select Monitor mode or Learn mode. Only recordings of the selected mode will be displayed. | |||
* Tool: Enter a tool number. Only recordings of the selected tool will be dis- played. | |||
* Section: Enter a section number. Only recordings of the selected section will be displayed. | |||
* Job: Enter a Job name. Only recordings of the job entered will be dis- played | |||
[[File:Recording Filters.png|center|thumb|733x733px|Recording Filters ]] | |||
Any number of recording filters may be used. To enable a filter, select an option from the filter's drop-down menu. Once all filters have been selected, click the APPLY FILTERS button to apply the filters to the recordings. | |||
'''Note:''' The Local/External toggle switch in the filter window determines which recordings are affected from the filters. External recordings are recordings that have imported from other TMAC systems. | |||
==== '''''Channel Buttons''''' ==== | ==== '''''Channel Buttons''''' ==== | ||
The Channel buttons above the Recording Viewer allow easy access to channel data from a recording. The data associated with each channel button are all displayed on the recording viewer. When a channel button is selected, the button's associated data is displayed on top of the other channel data. This feature provides quicker access to switch between recordings. It is also useful for com- parisons between iterative recordings of the same channel's operation. | |||
[[File:Channel Buttons.png|center|thumb|691x691px|Channel Buttons ]] | |||
=== '''Details Tab''' === | === '''Details Tab''' === | ||
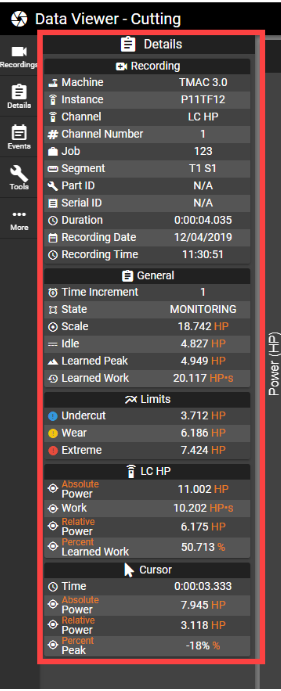
The Details tab provides additional data about the recording. Placing the cursor displays additional data dependent on the mode selected. | |||
* Cutting Mode: Placing a cursor displays channel data, limits, cut time, etc. at cursor location. | |||
* Millivolt Mode: Placing a cursor displays scale, absolute and relative sensor values, cut time etc... at cursor location. | |||
[[File:TI Editor Details Tab.png|center|thumb|TI Editor Details Tab ]] | |||
'''Note:''' The Details tab is where CNC data is viewable. | |||
=== '''Events Tab''' === | === '''Events Tab''' === | ||
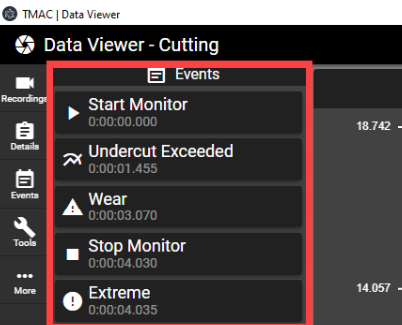
The Events tab displays a list of events including start monitors, stop monitors, alarms, and custom events. The time at which these events occurred during the operation is displayed below the event name. Additionally when an event is selected from the list, the recording viewer snaps to the location of the selected event. This feature makes it easier to locate specific data in long recordings. | |||
[[File:Events Tab.png|center|thumb|402x402px|Events Tab ]] | |||
=== '''Tools Tab''' === | === '''Tools Tab''' === | ||
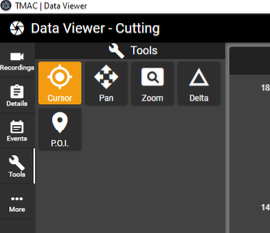
The Tools tab provides access to tools that manipulate the recording. The following tools are available: | |||
* Cursor: Place a cursor on the recording to display cut data or create a Time increment | |||
* Pan: Click and drag the recording to a specific spot | |||
* Zoom: Zoom in on a highlighted portion of the recording | |||
* Delta: Display differences between two selected data points on the recording | |||
* P.O.I: Add a custom point of interest to the recording | |||
[[File:Tools Tab.png|center|thumb|Tools Tab ]] | |||
'''Note:''' Each tool in the Tools tab can be used in conjunction with one another | |||
==== '''''Using the Cursor Tool''''' ==== | ==== '''''Using the Cursor Tool''''' ==== | ||
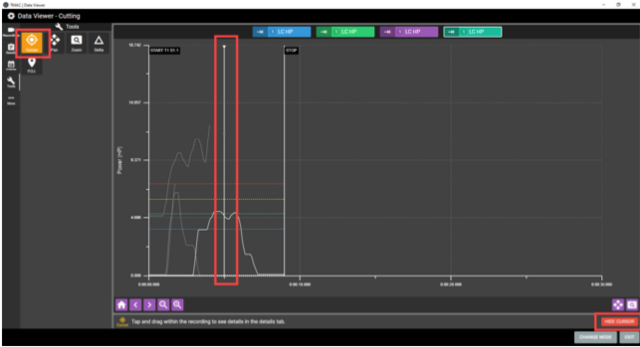
The cursor tool allows a cursor to be placed on the recording. Placing a cursor on the recording adds data at cursor location to the Details tab. Once the cursor is placed, it can be clicked and dragged to the desired location. To view the details at cursor location, select the details tab. Clicking the HIDE CURSOR button removes the cursor from the Recording Viewer. | |||
[[File:Cursor Tool.png|center|thumb|640x640px|Cursor Tool ]] | |||
==== '''''Using the Pan Tool''''' ==== | ==== '''''Using the Pan Tool''''' ==== | ||
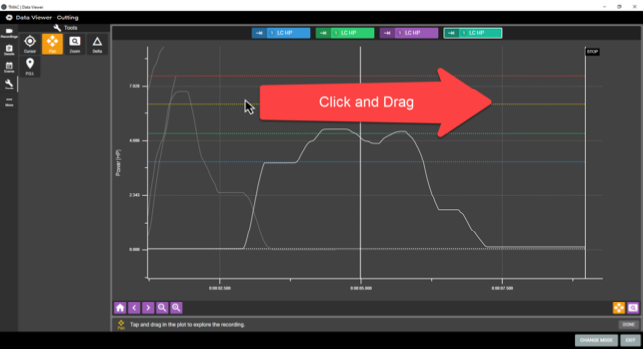
The Pan tool is used to move to specific parts of the recording. After selecting the Pan tool, click on the recording and drag in any direction to scroll the recording. This feature is particularly useful on touchscreens. click the DONE button to stop using the pan tool. | |||
[[File:Pan Tool.png|center|thumb|643x643px|Pan Tool ]] | |||
==== '''''Using the Zoom Tool''''' ==== | ==== '''''Using the Zoom Tool''''' ==== | ||
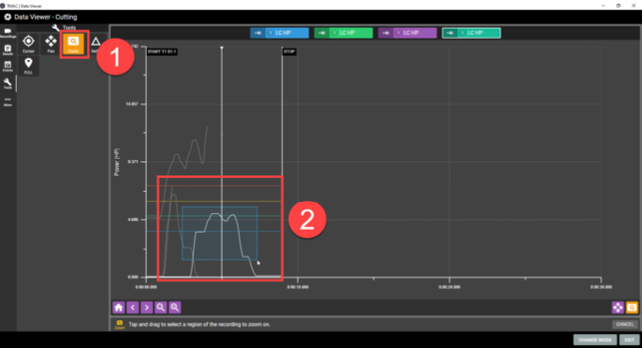
The Zoom tool is used to zoom to a specific portion of the recording. To use the Zoom tool use the following steps: | |||
# Select the Zoom tool from the tools tab | |||
# Highlight the portion of the recording to zoom in on by clicking and dragging on the recording. This draws a rectangle around the portion of the recording. | |||
# Release the click to zoom in on the highlighted portion of the recording | |||
[[File:Zoom Tool.png|center|thumb|643x643px|Zoom Tool ]] | |||
==== '''''Using a Delta Tool''''' ==== | ==== '''''Using a Delta Tool''''' ==== | ||
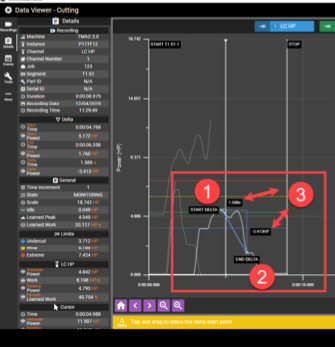
The Delta tool is used to view the difference in signal value and time between two selected points on the recording. To use the Delta tool use the following steps: | |||
# Select Delta from the tools tab | |||
## Note: The Details tab is automatically displayed. | |||
# Click on the recording viewer at the first data point | |||
# Click on the recording viewer at the second data point | |||
## The viewer draws a right triangle on the recording that displays the difference in time and signal value between the two points. | |||
# Click DONE | |||
[[File:Delta Tool.png|center|thumb|349x349px|Delta Tool ]] | |||
The delta triangle remains on the recording until the Delta tool is used again. Any delta placed on the recording does not persist if the recording is closed. | |||
==== '''''Using the P.O.I. Tool''''' ==== | ==== '''''Using the P.O.I. Tool''''' ==== | ||
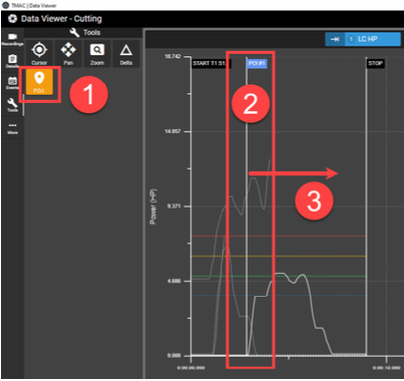
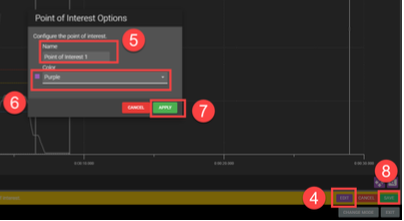
The Point of Interest tool (P.O.I.) is used to mark specific spots in the recording for further analysis. To add a P.O.I. marker to a recording, use the following steps: | |||
# Select the P.O.I. tool from the Tools tab | |||
# Click on the recording to place a P.O.I. cursor | |||
# Drag the cursor to the desired location | |||
# Click the EDIT button | |||
# Enter a name for the P .O.I. | |||
# Select a color to represent the P.O.I. | |||
# Click APPLY | |||
# Click Save | |||
The P.O.I is now saved with the recording. Points of interest can be edited and deleted on the Events tab of the Data Viewer. | |||
[[File:POI Tool.png|center|thumb|404x404px|POI Tool ]] | |||
[[File:Screen Shot 2022-09-14 at 1.35.45 PM.png|center|thumb|404x404px|POI Tool ]] | |||
=== '''More Tab''' === | === '''More Tab''' === | ||
The More tab provides an interface to import and export recordings for use in the Data Viewer. Exported recordings are saved in a text file with the .tmd extension. Exported recordings can be imported into any TMAC 3.0 system for review in the Data Viewer. | |||
[[File:More Tab.png|center|thumb|642x642px|More Tab ]] | |||
==== '''''Exporting Recordings''''' ==== | ==== '''''Exporting Recordings''''' ==== | ||
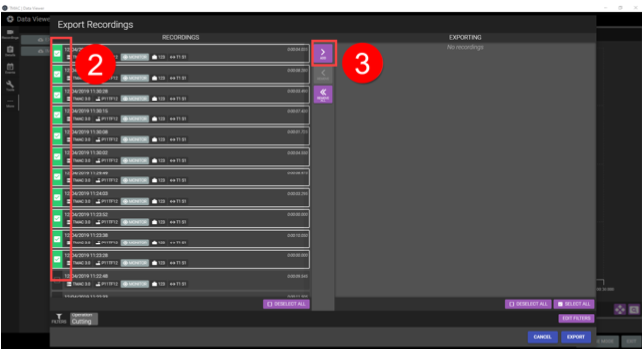
Perform the following steps to export chart data as a text file: | |||
# In the More tab, click the EXPORT RECORDINGS button | |||
# Select recordings to be exported from the list by marking the associated check-boxes. The recording list can be filtered in the same manner as when opening recordings. | |||
# Click the ADD button | |||
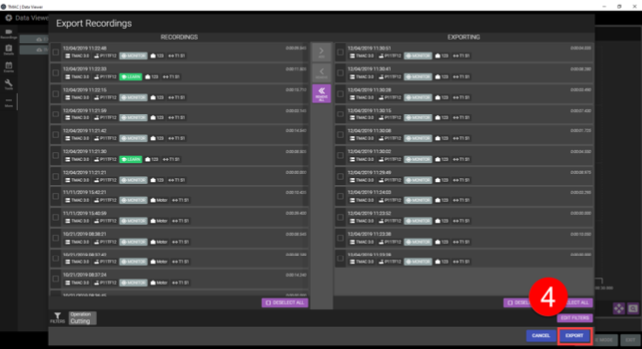
# Click Export. TMAC processes the selected recording data and builds a .tmd file | |||
# When the export operation is complete, click DOWNLOAD to save the text file to the desired file location. | |||
[[File:Exporting Chart Data Steps 1-3.png|center|thumb|642x642px|Exporting Chart Data Steps 1-3 ]] | |||
[[File:Exporting Chart Data Step 4.png|center|thumb|642x642px|Exporting Chart Data Step 4]] | |||
==== '''''Bulk Export Recordings''''' ==== | ==== '''''Bulk Export Recordings''''' ==== | ||
The data viewer's bulk export feature is used to export a large number of record- ings from a TMAC system to a .TMD file. Filters can be applied to the list of recordings to allow only recordings that match specific conditions determined by the user. Use the following steps to perform a bulk export of recordings to a .TMD file: | |||
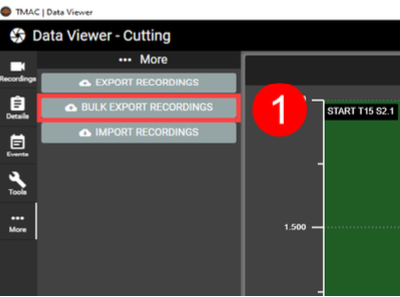
# Press the EXPORT RECORDINGS button | |||
# Apply any desired filters. | |||
# Press EXPORT | |||
[[File:Bulk Export Recordings Step 1.png|center|thumb|400x400px|Bulk Export Recordings Step 1 ]] | |||
[[File:Bulk Export Recordings Steps 2-3.png|center|thumb|398x398px|Bulk Export Recordings Steps 2-3 ]] | |||
==== '''''Importing Recordings''''' ==== | ==== '''''Importing Recordings''''' ==== | ||
Perform the following steps to import chart data for review in the Data Viewer: | |||
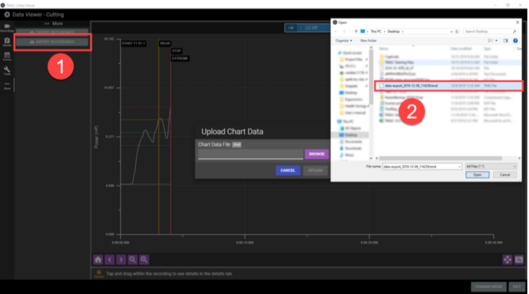
# In the More tab, click the IMPORT RECORDINGS button | |||
# Browse to and select the .tmd file | |||
# Select recordings to import from the list of recording | |||
# Click ADD. Alternatively, all recordings can be added to the import list immediately by click the ADD ALL button. | |||
# Click IMPORT | |||
[[File:Selecting Recording File.png|center|thumb|529x529px|Selecting Recording File ]] | |||
[[File:Selecting Recordings for Import.png|center|thumb|532x532px|Selecting Recordings for Import ]] | |||
==== '''''Opening Imported Chart Files''''' ==== | ==== '''''Opening Imported Chart Files''''' ==== | ||
Once recordings have been imported from an outside source, the recordings can be opened in the Data Viewer. Imported recordings are opened in the same manner as local recordings, but a few additional steps are required. Use the following steps to open external recordings in the viewer: | |||
# On the Recordings tab, click OPEN | |||
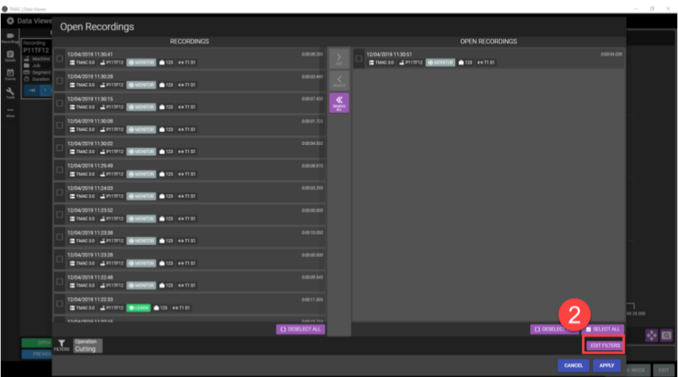
# The recordings listed by default are the local recordings. To view the imported or external recordings click the EDIT FILTERS button | |||
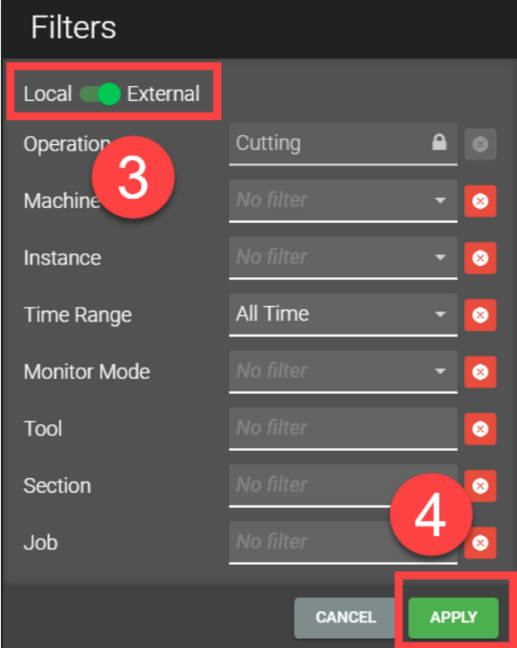
# Click the LOCAL/EXTERNAL toggle button | |||
# Click APPLY | |||
[[File:Edit Filters.png|center|thumb|678x678px|Edit Filters ]] | |||
[[File:Local-External Toggle.png|center|thumb|649x649px|Local/External Toggle ]] | |||
== '''Data Viewer: Bearing Health Mode''' == | == '''Data Viewer: Bearing Health Mode''' == | ||
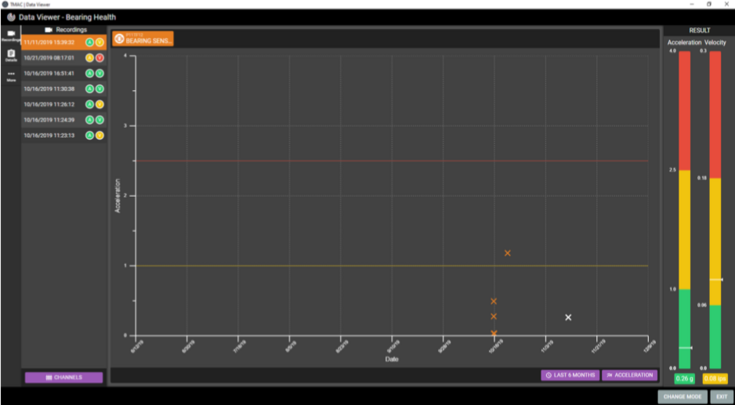
When Bearing Health mode is selected, the Data Viewer opens displaying a plot of the last six months of Bearing Health Acceleration results. The Data Viewer interface is split into two sections: A tool bar and a chart displaying bearing health results over time. Additionally, two bars display bearing results for the bearing health recording selected in the list of recordings. The tool bar provides various data regarding the results of the selected recording as well as the ability to export and delete bearing health recordings. | |||
The Data Viewer tool bar has the following tabs in Bearing Health mode: | |||
* Recordings | |||
* Details | |||
* More | |||
[[File:Bearing Health Mode Data Viewer.png|center|thumb|735x735px|Bearing Health Mode Data Viewer ]] | |||
=== '''Recording Tab''' === | === '''Recording Tab''' === | ||
The Recordings tab displays a list of all Bearing Health recordings for the channel displayed at the top of the chart. Each recording in the list displays date and time stamps of the recording. Additionally, the color of the icons represents the results of the recording. Selecting a recording from the list does the following: | |||
# Updates the results bars with the acceleration and velocity results for the selected recording | |||
# Changes the recordings mark on the chart to white | |||
# Displays additional data on the Details tab | |||
[[File:Recordings tab.png|center|thumb|600x600px|Recordings Tab ]] | |||
=== '''Details Tab''' === | === '''Details Tab''' === | ||
* The Details tab provides additional data about the selected bearing health recording. The following data is provided: | |||
* Channel Name | |||
* Channel Number | |||
* Instance | |||
* Machine | |||
* Acceleration Result | |||
* Acceleration RMS | |||
* Crest Factor | |||
* High Pass Acceleration | |||
* Peak Temperature | |||
* Sampling Frequency | |||
* Time Wave Form Peak | |||
* Velocity Result | |||
* Velocity RMS | |||
[[File:Screen Shot 2022-09-14 at 2.01.26 PM.png|center|thumb|813x813px|Details Tab ]] | |||
=== '''Additional Interface Buttons''' === | === '''Additional Interface Buttons''' === | ||
While in Bearing Health mode, the Data Viewer has thee buttons that impact the data displayed on the chart. | |||
[[File:Screen Shot 2022-08-31 at 1.27.53 PM.png|center|thumb|812x812px|Recording Viewer Button Functions]] | |||
Latest revision as of 13:25, 26 October 2022
Overview
The TMAC Data Viewer is a diagnostics tool for analyzing historical data. The Data Viewer allows graphical viewing of TMAC recordings. Various tools are available in the Data Viewer to analyze data. The Data Viewer interface and functionality varies based on the mode of operation selected at launch. The following modes of operation are available:
- Cutting Mode
- Bearing Health
- Millivolt Mode
Note: The Change Mode button allows the user to switch between modes in the Data Viewer.
Data Viewer: Cutting and Millivolt Modes
The interface and functionality of the Data Viewer are the same for Cutting Mode and Millivolt Mode. Minor differences occur in the units displayed on the recording and in the data reported in the Details Tab.
When Cutting Mode or Millivolt Mode is selected, the Data Viewer opens the most recent recording for the selected mode. The Data Viewer interface is split into two sections: A tool bar and a graphical display of the operation recording. The tool bar provides information about the operation and provides several tools for analyzing recordings.
The Data Viewer tool bar has the following tabs:
- Recordings
- Details
- Events
- Tools
Recording Viewer
The Recording Viewer portion of the Data Viewer offers a graphical representation of the selected operation. The recording of the operation can be manipulated with a set of buttons available at the bottom of the Recording Viewer.
Recording Tab
The Recording tab is used to open recordings for viewing. Multiple recordings can be opened simultaneously. Open recordings are listed on the left of the recording viewer. Each open recording is represented by an information card that includes additional data. Any number of recording cards can be opened simultaneously.
Recording Cards
The recording cards display the following information about the recording:
- Date and Time Stamp
- Instance Name
- Machine Name
- Job Name (Cutting Mode only)
- Segment Name (Operation)
- Cut Duration
- Channel Name
Each recording card has check-boxes for each channel associated with the recording. Marking these check-boxes adds a Channel button above the recording viewer for the associated channel. When multiple channel check-boxes are marked, the data for each channel overlays in the recording viewer. This allows for quick and easy comparisons of data. Up to four channels can be marked for comparison.
Note: Recording cards may have multiple channel check-boxes. This occurs when the recorded operation included a multichannel start.
In addition to the recording cards displayed, there are buttons available that manipulate the list.
Opening a Recording Card
Clicking the OPEN button on the Recordings tab opens a window displaying a list of available recordings and a list of open recordings. This window offers a simple interface to open multiple recordings at once in the Data Viewer. To open recordings in the Data Viewer, use the following steps:
- Click the OPEN button on the Recordings tab
- Available recordings are on the left hand side of the window. Select the recording(s) to open by clicking the check-boxes next to the desired recordings.
- Click the ADD button to move the selected recordings to the Open Recordings list.
- Click APPLY to open the recordings in the Data Viewer
The selected recordings are added to the list of recordings in the Data Viewer and are available for viewing.
Applying Recording Filters
The list of available recordings may be very large. Filters are available when selecting a recording to open. To access the recording filters, click the EDIT FILTERS button. The following filters are available:
- Machine: Select from a list of machines names. Only recordings from the selected machine will be displayed
- Instance: Select from a list of instances. Only recordings from the selected instance will be displayed
- Time Range: Select from a list of preset time frames or set a custom time frame. A custom time frame is defined by the user by specifying a date and time for the start and end of the time range. Only recordings within the selected time frame will be viewable in the list of recordings.
- Alarm: Filter recordings by alarm type. Only recordings containing the selected alarm condition are displayed. Selecting No Alarm displays only recordings without alarm conditions.
- Monitor mode: Select Monitor mode or Learn mode. Only recordings of the selected mode will be displayed.
- Tool: Enter a tool number. Only recordings of the selected tool will be dis- played.
- Section: Enter a section number. Only recordings of the selected section will be displayed.
- Job: Enter a Job name. Only recordings of the job entered will be dis- played
Any number of recording filters may be used. To enable a filter, select an option from the filter's drop-down menu. Once all filters have been selected, click the APPLY FILTERS button to apply the filters to the recordings.
Note: The Local/External toggle switch in the filter window determines which recordings are affected from the filters. External recordings are recordings that have imported from other TMAC systems.
Channel Buttons
The Channel buttons above the Recording Viewer allow easy access to channel data from a recording. The data associated with each channel button are all displayed on the recording viewer. When a channel button is selected, the button's associated data is displayed on top of the other channel data. This feature provides quicker access to switch between recordings. It is also useful for com- parisons between iterative recordings of the same channel's operation.
Details Tab
The Details tab provides additional data about the recording. Placing the cursor displays additional data dependent on the mode selected.
- Cutting Mode: Placing a cursor displays channel data, limits, cut time, etc. at cursor location.
- Millivolt Mode: Placing a cursor displays scale, absolute and relative sensor values, cut time etc... at cursor location.
Note: The Details tab is where CNC data is viewable.
Events Tab
The Events tab displays a list of events including start monitors, stop monitors, alarms, and custom events. The time at which these events occurred during the operation is displayed below the event name. Additionally when an event is selected from the list, the recording viewer snaps to the location of the selected event. This feature makes it easier to locate specific data in long recordings.
Tools Tab
The Tools tab provides access to tools that manipulate the recording. The following tools are available:
- Cursor: Place a cursor on the recording to display cut data or create a Time increment
- Pan: Click and drag the recording to a specific spot
- Zoom: Zoom in on a highlighted portion of the recording
- Delta: Display differences between two selected data points on the recording
- P.O.I: Add a custom point of interest to the recording
Note: Each tool in the Tools tab can be used in conjunction with one another
Using the Cursor Tool
The cursor tool allows a cursor to be placed on the recording. Placing a cursor on the recording adds data at cursor location to the Details tab. Once the cursor is placed, it can be clicked and dragged to the desired location. To view the details at cursor location, select the details tab. Clicking the HIDE CURSOR button removes the cursor from the Recording Viewer.
Using the Pan Tool
The Pan tool is used to move to specific parts of the recording. After selecting the Pan tool, click on the recording and drag in any direction to scroll the recording. This feature is particularly useful on touchscreens. click the DONE button to stop using the pan tool.
Using the Zoom Tool
The Zoom tool is used to zoom to a specific portion of the recording. To use the Zoom tool use the following steps:
- Select the Zoom tool from the tools tab
- Highlight the portion of the recording to zoom in on by clicking and dragging on the recording. This draws a rectangle around the portion of the recording.
- Release the click to zoom in on the highlighted portion of the recording
Using a Delta Tool
The Delta tool is used to view the difference in signal value and time between two selected points on the recording. To use the Delta tool use the following steps:
- Select Delta from the tools tab
- Note: The Details tab is automatically displayed.
- Click on the recording viewer at the first data point
- Click on the recording viewer at the second data point
- The viewer draws a right triangle on the recording that displays the difference in time and signal value between the two points.
- Click DONE
The delta triangle remains on the recording until the Delta tool is used again. Any delta placed on the recording does not persist if the recording is closed.
Using the P.O.I. Tool
The Point of Interest tool (P.O.I.) is used to mark specific spots in the recording for further analysis. To add a P.O.I. marker to a recording, use the following steps:
- Select the P.O.I. tool from the Tools tab
- Click on the recording to place a P.O.I. cursor
- Drag the cursor to the desired location
- Click the EDIT button
- Enter a name for the P .O.I.
- Select a color to represent the P.O.I.
- Click APPLY
- Click Save
The P.O.I is now saved with the recording. Points of interest can be edited and deleted on the Events tab of the Data Viewer.
More Tab
The More tab provides an interface to import and export recordings for use in the Data Viewer. Exported recordings are saved in a text file with the .tmd extension. Exported recordings can be imported into any TMAC 3.0 system for review in the Data Viewer.
Exporting Recordings
Perform the following steps to export chart data as a text file:
- In the More tab, click the EXPORT RECORDINGS button
- Select recordings to be exported from the list by marking the associated check-boxes. The recording list can be filtered in the same manner as when opening recordings.
- Click the ADD button
- Click Export. TMAC processes the selected recording data and builds a .tmd file
- When the export operation is complete, click DOWNLOAD to save the text file to the desired file location.
Bulk Export Recordings
The data viewer's bulk export feature is used to export a large number of record- ings from a TMAC system to a .TMD file. Filters can be applied to the list of recordings to allow only recordings that match specific conditions determined by the user. Use the following steps to perform a bulk export of recordings to a .TMD file:
- Press the EXPORT RECORDINGS button
- Apply any desired filters.
- Press EXPORT
Importing Recordings
Perform the following steps to import chart data for review in the Data Viewer:
- In the More tab, click the IMPORT RECORDINGS button
- Browse to and select the .tmd file
- Select recordings to import from the list of recording
- Click ADD. Alternatively, all recordings can be added to the import list immediately by click the ADD ALL button.
- Click IMPORT
Opening Imported Chart Files
Once recordings have been imported from an outside source, the recordings can be opened in the Data Viewer. Imported recordings are opened in the same manner as local recordings, but a few additional steps are required. Use the following steps to open external recordings in the viewer:
- On the Recordings tab, click OPEN
- The recordings listed by default are the local recordings. To view the imported or external recordings click the EDIT FILTERS button
- Click the LOCAL/EXTERNAL toggle button
- Click APPLY
Data Viewer: Bearing Health Mode
When Bearing Health mode is selected, the Data Viewer opens displaying a plot of the last six months of Bearing Health Acceleration results. The Data Viewer interface is split into two sections: A tool bar and a chart displaying bearing health results over time. Additionally, two bars display bearing results for the bearing health recording selected in the list of recordings. The tool bar provides various data regarding the results of the selected recording as well as the ability to export and delete bearing health recordings.
The Data Viewer tool bar has the following tabs in Bearing Health mode:
- Recordings
- Details
- More
Recording Tab
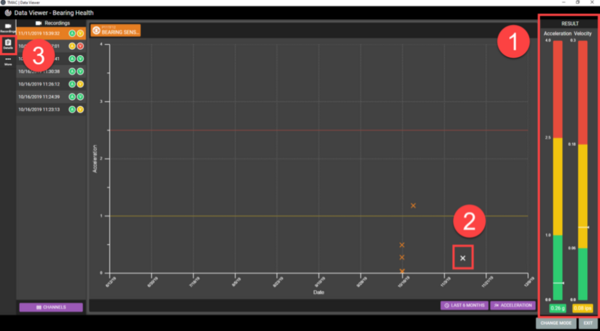
The Recordings tab displays a list of all Bearing Health recordings for the channel displayed at the top of the chart. Each recording in the list displays date and time stamps of the recording. Additionally, the color of the icons represents the results of the recording. Selecting a recording from the list does the following:
- Updates the results bars with the acceleration and velocity results for the selected recording
- Changes the recordings mark on the chart to white
- Displays additional data on the Details tab
Details Tab
- The Details tab provides additional data about the selected bearing health recording. The following data is provided:
- Channel Name
- Channel Number
- Instance
- Machine
- Acceleration Result
- Acceleration RMS
- Crest Factor
- High Pass Acceleration
- Peak Temperature
- Sampling Frequency
- Time Wave Form Peak
- Velocity Result
- Velocity RMS
Additional Interface Buttons
While in Bearing Health mode, the Data Viewer has thee buttons that impact the data displayed on the chart.


