m (Text replacement - "Back to Detect-IT Home Page" to "Category:DTect-IT Return to DTect-IT Main Page") |
|||
| (One intermediate revision by one other user not shown) | |||
| Line 1: | Line 1: | ||
[[ | [[Category:DTect-IT]] | ||
[[DTect-IT|Return to DTect-IT Main Page]] | |||
== '''Overview''' == | == '''Overview''' == | ||
Latest revision as of 12:40, 11 January 2023
Overview
DTect-IT is capable of running a limit analysis on a monitored signal. A limit analysis tests various measured values against user programmed limits. When a limit condition is exceeded, an alarm is triggered. This will alert an operator when an abnormal running condition occurs in the process and will assist in preventing disruptions in the operation.
Limit Analysis Wizard
The Limit Analysis wizard eases the setup of a Limit Analysis by guiding the user through the settings step by step. To set up a new Limit Analysis, click the Create button in the General Settings menu and select Limit. This launches the Limit Analysis Wizard. Perform the following steps in the wizard to create the analysis:
- Press Begin.
- Select or Create a new sensor for the analysis to utilize.
- Select a Channel and Unit Type from the drop down menu.
- Select a filtering mode.
- Enter a name for the analysis and Press Finish.
After finishing the analysis, the Limit analysis settings menu will be opened.
Limit Analysis User Interface
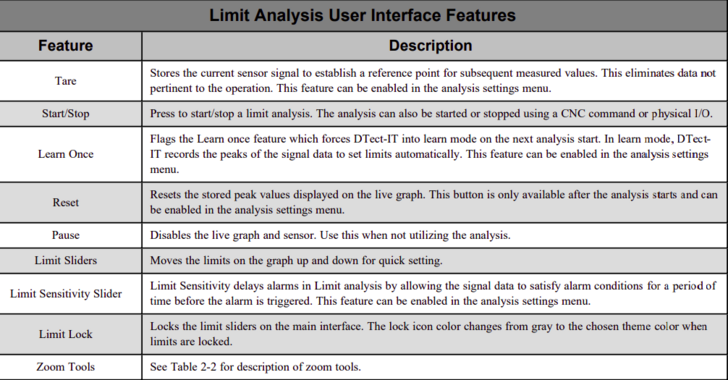
The Limit Analysis user interface displays one live graph for monitoring data in real time. When running a limit analysis, DTect-IT tests the measured data against user programmed limits. If a limit is exceeded, an alarm is triggered. The following buttons and features are available in the limit analysis user interface:
Performing a Limit Analysis
To perform a limit analysis, start by setting limits. This can be done three ways:
- Using the slider bars in the user interface
- Setting a numerical value in the settings menu for the analysis
- Running the machining process in Learn mode.
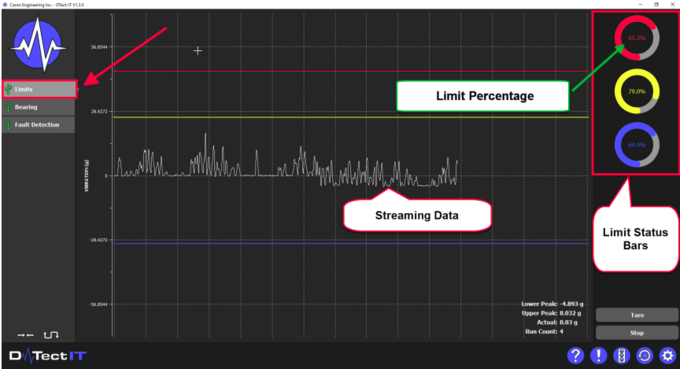
If not utilizing Learn mode, run the machining process without starting the analysis. While the process is running, observe how the signal data is affected by the limits. Make small adjustments to the limits, as needed. Once limits are set, start the analysis with by pressing the Start button. When the analysis starts, DTectIT monitors the measured data against the set limits until the Stop button is pressed or a stop command is received from the CNC. After the limit analysis starts, the limit slider bars will be replaced by three limit status dials. The three limits are upper (red), warning (yellow), and lower (blue). The status dials fill as the monitored data approaches the limits. Additional data is displayed in the bottom right hand side of the graph. This data includes the upper and lower peaks, the current actual data measurement and the run count, if enabled. When a limit is met or exceeded (falls below for lower limit), an alarm occurs. The alarm condition can vary based on the limit settings for the analysis. This includes, but is not limited to, limit type and limit sensitivity. Various limit types have different alarm conditions and behavior. Limit sensitivity acts as an alarm delay for all limits.
After an alarm triggers, DTect-IT will only stay in the alarm state if the alarm conditions continue to be satisfied or if the latching alarms feature is enabled in the settings.
Using Learn Once to Set Limits
Limit analysis allows limits to be programmed automatically with the Learn Once feature. To utilize Learn Once, it must first be enabled in the analysis settings menu. Once learn is enabled, pressing the Learn Once button prompts DTect-IT to enter Learn mode the next time the limit analysis is started. When the analysis is started, the background color of the live graph changes to green and DTect-IT begins monitoring the signal data for the upper and lower peaks of the signal.
While DTect-IT is in Learn mode, run the complete machining process to be monitored. When the process is complete, press the Stop button to end the analysis. DTect-IT utilizes the recorded upper and lower peaks of the signal to adjust the limits and graph scale on the User interface.
Limits are calculated using the peaks (upper and lower) of the data signal and an Autoscale percentage set by the user in the analysis settings. The default Autoscale percentages are 30%, 20%, 30% for the Upper limit, Warning Limit, and Lower Limit respectively. The following is an example of limit calculations for a process with an upper peak of 20HP and a lower peak of 10HP, assuming default Autoscale percent:
- Upper Limit = Upper Peak + (abs(Upper Peak - Lower Peak)*0.30) = 23HP
- Warning Limit = Upper Peak + (abs(Upper Peak - Lower Peak)*0.20)= 22HP
- Lower Limit = Lower Peak - (abs(Upper Peak - Lower Peak)*0.30) = 7HP
Utilizing Limit Sensitivity
Limit Sensitivity is an optional feature available in DTect-IT that alters how alarms are triggered during a Limit Analysis. When Limit Sensitivity is enabled in the analysis setting, an additional slider bar becomes available on the user interface.
Limit Sensitivity allows DTect-IT to delay an alarm from triggering even after the alarm condition is satisfied. The delay is applied to all enabled limits in the analysis. Adjusting the Limit Sensitivity slider bar changes how long an alarm is delayed after the alarm condition is satisfied. Increasing the Sensitivity applies a short alarm delay whereas decreasing Sensitivity applies a longer delay. This is represented visually in the Limit Sensitivity dial. When an alarm condition is satisfied, the corresponding Limit Sensitivity dial begins to fill. The Limit Sensitivity bar fills quickly for increased sensitivity and it fills slowly for decreased sensitivity. When the bar is completely filled, the alarm triggers.
Limit Types for Limit Analysis
Limit types change how the limit analysis triggers an alarm condition based on the signal value. The following Limit types are available:
- Running: An alarm occurs when the sensor signal value:
- exceeds the warning limit value
- exceeds the upper limit value, or
- falls below the lower limit value
The Limit analysis remains in alarm until the alarm condition is no longer satisfied (e.g. the sensor signal value falls below the set warning limit value). Running limit type is available for upper, warning and lower limits.
- Latching: An alarm condition is triggered in the same manner as a running limit type, but the limit analysis remains in alarm until the analysis is reset. Latching limit type is available for upper, warning and lower limits.
- Must Exceed: The must exceed limit type is only available for the lower limit. When the must exceed limit type is selected, the signal value must exceed the lower limit at least once during the limit analysis. When the limit analysis is stopped, the analysis will trigger a lower alarm if the signal value did not exceed the lower limit.
- Work Latching: This limit utilizes accumulated work to calculate the warning limit. A warning alarm is triggered when the accumulated work exceeds the value of this limit. l Work Must Exceed: This limit utilizes accumulated work to calculate the lower limit. The accumulated work must meet the value in this limit before the analysis is stopped, otherwise a lower alarm is triggered.
Example: Latching Alarms vs Running Alarms
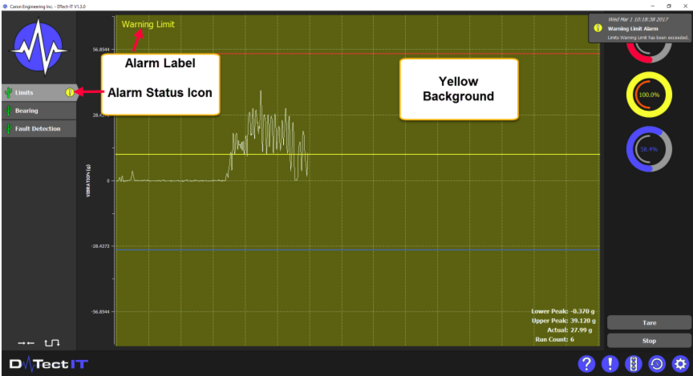
When an alarm is triggered for a running limit, DTect-IT leaves the alarm state if the alarm condition does not continue to be satisfied. This can be seen in the figures below
When an alarm is triggered while utilizing latching limits for a limit analysis, DTect-IT remains in the triggered alarm condition until reset. The Reset button appears in the user interface after a latching alarm is triggered.
Using Work for Limits
Work limits can be set for warning and lower limits in a Limit Analysis. When a work limit is enabled in the limit settings, DTect-IT tests the accumulated work measured from the sensor (also referred to as "area under the curve") against a learned work value. The limits must be set by utilizing the Learn Once feature (See "Using Learn Once to Set Limits". To utilize a work limit, set the limit type in the limit settings. The following options are available:
- Warning Limit-Work Latching: An alarm is triggered when the accumulated work exceeds the work value set for this limit. The resulting alarm must be reset to be cleared.
- Lower Limit- Must Exceed Work: An alarm is triggered if the accumulated work does not exceed the work value set for this limit.
After adjusting the settings for work limits, set the learn once feature and run the limit analysis. As the analysis runs, DTect-IT calculates and learns the accumulated work. When the process is complete, the work limit values are set utilizing the following formulas:
Warning Limit = Learned Accumulated Work+ (Learned Accumulated Work * Learn Auto-scale %) Lower Limit = Learned Accumulated Work * Learn Auto-scale %
On the next run of the limit analysis, DTect-IT will test the accumulated work against the learned work limits. As work accumulates, the limit status dials fill as normal, but are a representation of accumulated work.
Status Icons
In the analysis tab for a limit analysis, icons will appear based on the alarm status of the analysis. If any alarm condition is triggered when the analysis is running, an icon will appear in the analysis tab.
Limit Analysis Settings
In the Limit Analysis settings menu, the following parameters can be programmed no matter which tab is open:
- Name: Change the analysis name in this field.
- Enabled: Enables or disables the analysis. Disabling the analysis will remove it from the list of analyses in the main user interface, but will not delete the analysis.
- Notifications: Enables or disables notifications for the analysis. Disabling notifications prevents notifications for the analysis from being stored in the Notification Center.
- Enable Run Count: Enables a run count for the analysis. Increments by one every time the analysis is run, start to stop. The current run count is displayed in the analysis settings menu and on the live graph.
- Reset Run Count: Resets the current run count back to zero.
Graph Tab
The following table displays the graph tab settings for limit analysis:
Note: Graph Time and Sample Rate are normally are left at their default values.
History Tab
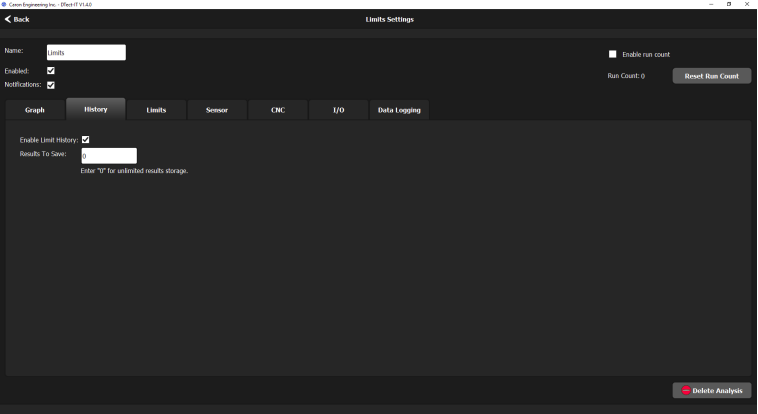
The following parameters can be set in the History tab:
- Enable Limit History: Enables the History View page for the analysis.
- Results to Save: Sets the number of Limit Analysis results that DTect-IT will save. After the programmed number of results is reached, any additional analysis results will replace the oldest analysis result. Enter "0" for unlimited result storage.
Limits Tab
The following parameters can be set in the Limits tab:
Note: Limits and Limit Sensitivity can also be set using the slider bars on the limit analysis user interface.
Sensor Tab
The following parameters can be set in the Sensor Tab:
- Sensor: Choose the Sensor to be utilized by the analysis, or create a new sensor using the Create Sensor button.
- Filtering mode: Select a data filter from the drop-down list. The following filters are available:
- Averaging Filter: Centers the signal at zero and averages the total magnitude of the signal. This filter is useful for overall vibration.
- Rectify Peaks Filter: Centers the signal at zero and shows the absolute value of the signal. Useful for looking for high peaks in any direction.
- No Filter: Displays raw signal data.
- Custom Filter: Creates a custom filter by allowing the user to set low pass and/or a high pass cutoff frequencies to be applied to the signal. Check the box(es) to enable one or both of the cutoff frequencies. Then set the frequency(Hz) in the field to the right for each frequency cutoff enabled.
CNC Tab
The following parameters can be set in the CNC Configuration tab:
- Device: Select a CNC from the drop-down menu. If a CNC has not been created, use the create button to open the wizard for the desired CNC.
- Commands Enabled: Check the box to enable communication between the analysis and the specified CNC device.
- Command ID: The integer value used to send commands from the CNC to the analysis.
- Register: Specify the register type and a variable to send CNC commands through. The device registers and I/O in use by DTect-IT can be viewed in the field at the bottom of this tab.
- Enable analysis specific variables and source: Press the check boxes to enable more analysis specific information to be written to the CNC. Select which register and variable DTect-IT should use when writing data to the CNC. The following can be enabled for limit analysis:
- Acknowledge: The acknowledge register is populated with the corresponding value when the analysis is started or stopped.
- Alarm: Writes the alarm status of the analysis to the specified variable.
- Graph Value: Writes the currently monitored graph value to the specified variable.
- Lower Peak Value: Writes the lowest recorded value to the specified variable.
- Upper Peak Value: Writes the highest recorded value to the specified variable.
- Run Count Value: Writes the recorded run count to the specified variable.
Alarm and Command Codes for Limit Analysis
The table below displays the limit analysis alarm codes.
CNC Commands and Command Returns
The tables below display command codes and command return codes for Limit Analysis.
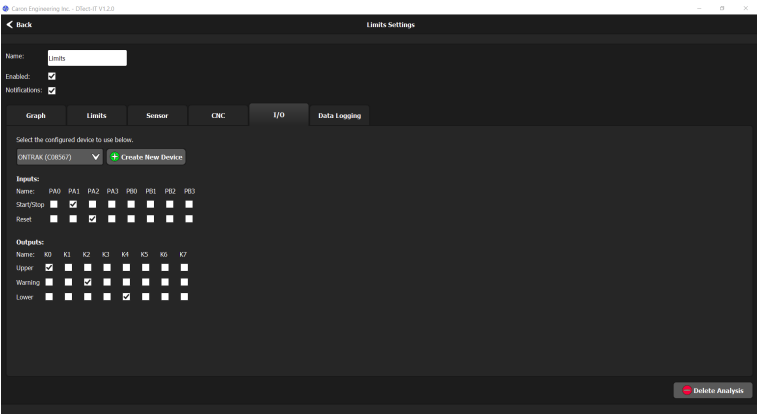
I/O Tab
The following parameters can be set in the I/O tab:
- Device: Assign an I/O device to the analysis. If one has not been created yet, one can be created using the Create New Device button.
- Inputs: Assign analysis features to specific inputs. When the Inputs are toggled, the analysis feature mapped to the input is activated. The following features can be mapped to inputs for limit analysis:
- Start/Stop: When this feature is mapped to an input and the input is turned on, the analysis will start running. When turned off, the analysis will stop.
- Reset: This feature is used in conjunction with latching limits. If a limit latches, the input mapped to this feature can be pulsed to reset the alarm condition for the analysis.
- Outputs: Assign analysis features to specific outputs. The following features can be mapped to outputs for limit analysis: o Acknowledge: The acknowledge output bit turns on when the analysis is started and the bit turns off when the analysis is stopped.
- Upper Limit: When an Upper alarm is triggered, the mapped output turns on.
- Warning Limit: When a Warning alarm is triggered, the mapped output turns on.
- Lower Limit: When a Lower alarm is triggered, the mapped output turns on.
Note: The I/O device must be configured and connected to a USB port on the PC that DTect-IT is installed for any I/O parameters to be accessed in DTect-IT.
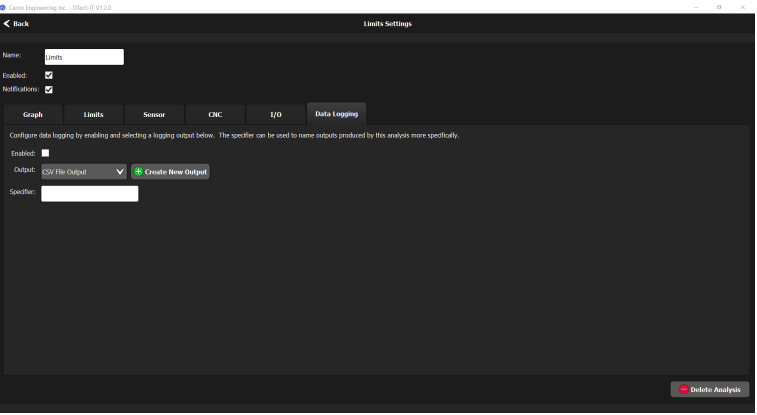
Data Logging Tab
The following parameters can be set in the Data Logging Tab:
- Enabled: Enables data logging for the analysis.
- Output: Specify the type of data file output. If an output has not been created yet, one can be created using the create button.
- Specifier: A specifier is added to the file naming convention when log files are generated for the analysis. This allows the data files for specific analyses to be organized separately from the normal naming convention
Limit Analysis History View
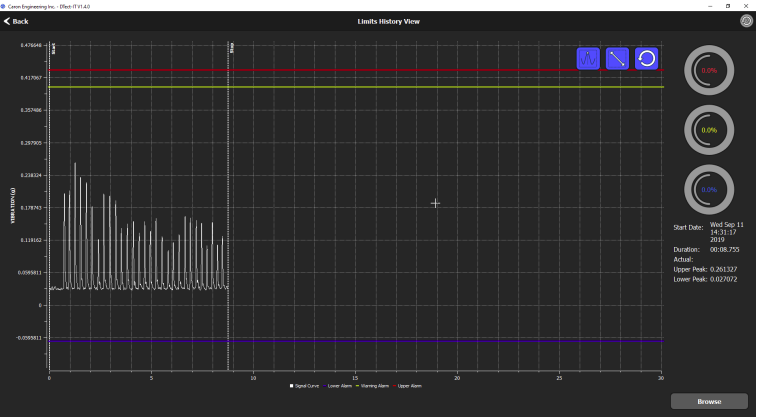
If a Limit Analysis is selected in the main user interface and history view is enabled in the settings, pressing the History View button will open a screen displaying a recording of the most recent analysis performed.
Note: Due to a redesign of the database structure, all historical data will not be backwards compatible with any existing 1.5.x and below versions of DTect-IT. It is recommended all old data is backed up after install of DTect-IT 1.6.0.
Limit Analysis Recordings
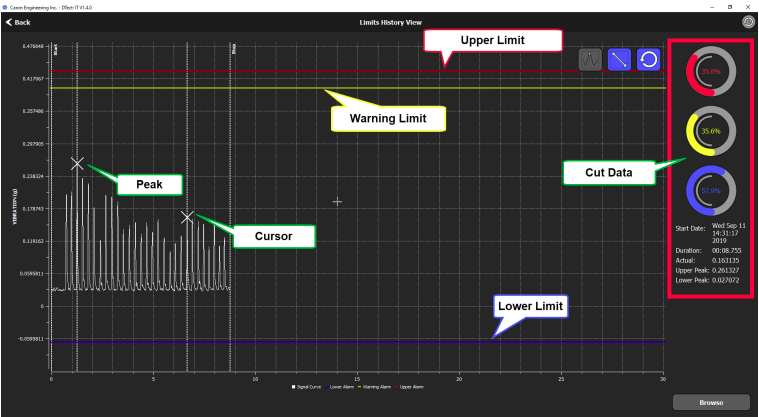
If History View is enabled, DTect-IT creates a recording of each run of the analysis. Each recording contains a graphical display of the operation as well as additional cut and limit data. Clicking on the graph places a cursor, represented by a vertical dotted line and an "X", and displays relevant cut data on the right side of the recording. The following cut data is displayed:
- Limit Status Bars: Limit status bars are displayed for each limit enabled in the analysis. In the Limit Analysis interface, these status bars represent how close the cutting load is to triggering the associated alarm. If a cursor is placed on the recording a snapshot of the limit status bars is displayed for the selected cursor location.
- Start Date: The date and time stamp of when the analysis was started
- Duration: Total time between the start and stop of the analysis
- Actual: The value of the monitored sensor at the cursor location
- Upper Peak: The highest recorded sensor value of the analysis
- Lower Peak: The lowest recorded sensor value of the analysis
Additionally, there are three buttons available to manipulate the recording for easier viewing. The three buttons in the recording graph are described in the table below
Selecting a Recording
Pressing the Browse button on the Limit Analysis History View opens a list of recordings saved from the analysis. The recordings are listed in a tabular format displaying the following information:
- Date: Date and time stamp for the recording
- Mode: Displays the mode of the recording; Learn or Monitor
- Alarm: Displays the number of alarms that occurred during the recording
Double-clicking on any recording in the list opens the selected recording in the history view window. Alternatively, a recording can be opened by single-clicking it and pressing the Open button.
Filtering Recordings
There may be a very large number of recordings available for selection in the list. DTect-IT offers a variety of list filters (located on the right of the selection window) to ease finding the desired recording. The following recording filters are available:
- Monitor: If checked, displays all recordings that are monitor mode
- Learn: If checked, displays all recordings that are learn mode
- Alarm: If checked, displays all recordings that contain alarms
- Date Range: If checked, allows a date range to be entered in the From and To dropdowns. Once a date range is selected, only recordings that occur within the selected dates are displayed
Deleting a Recording
To delete a recording from the list, perform the following steps:
- If, necessary, apply selection filters
- Select the recording from the list
- Press the Delete button
- Press Yes
The recording is removed from the list.
