Reporting downtime
- Visit the production chart for the machine you are reporting downtime on and navigate to the day the downtime occurred.
- Select the downtime on the chart by clicking and dragging. The vertical size and position of the selection are ignored.
- Right-click on the chart and select "Report downtime..."
- Select the maintenance issue that caused the downtime (if any), verify or adjust the value lost to downtime, and enter notes about the downtime.
- Click OK. The downtime block will be highlighted in red on the chart, and an entry will appear in the downtime table below the chart.
To edit a downtime block, find it in the downtime table below the production part and click Details.
Downtime will also appear when entering shift notes.
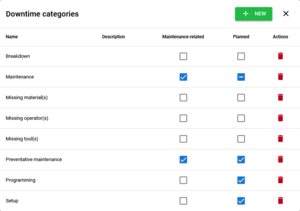
Downtime categories
Downtime can be grouped into categories for easier data analysis and reporting.
Administrators can customize the list of available categories from the edit menu on the machines page, or from the category dropdown list while reporting downtime.
If a maintenance-related category is selected while reporting downtime, additional options will be shown for linking the downtime block to a maintenance item and/or issue.
Categories can be planned, unplanned, or either (indicated by a crossed-out checkbox in the Planned column). If a planned or unplanned category is selected while reporting downtime, the user will not be able to set the planned state.
Viewing downtime
By date
The downtime blocks for a single day on a single machine are listed below the production chart for that day.
By cause
The total length and value of all downtime blocks for a single maintenance issue are listed in the issues table on the maintenance page.
