Overview
DTect-IT is capable of monitoring a range of frequencies by sampling data from an assigned sensor. The sampled data is manipulated using a linear fast Fourier transform (FFT). This allows DTect-IT to monitor data in the frequency domain (g over Hz). An alarm is triggered when the vibration energy (g) deviates from the user programmed range limits. Frequency Analysis can be useful in tracking RPMs by verifying the machine is operating at the programmed RPM range.
Frequency Analysis Wizard
The Frequency Analysis wizard eases the setup of a Frequency Analysis by guiding the user through the settings step by step. To set up a new Frequency Analysis, click the Create button in the General Settings menu and select Frequency. This launches the Frequency Analysis Wizard. Perform the following steps in the wizard to create the analysis:
- Press Begin.
- Select or Create a new sensor for the analysis to utilize.
- Enter a name for the analysis and Press Finish.
After finishing the analysis, the Frequency analysis settings menu will be opened.
Note: After creating a frequency analysis, at least one range needs to be created before the settings menu can be exited.
Frequency Analysis User Interface
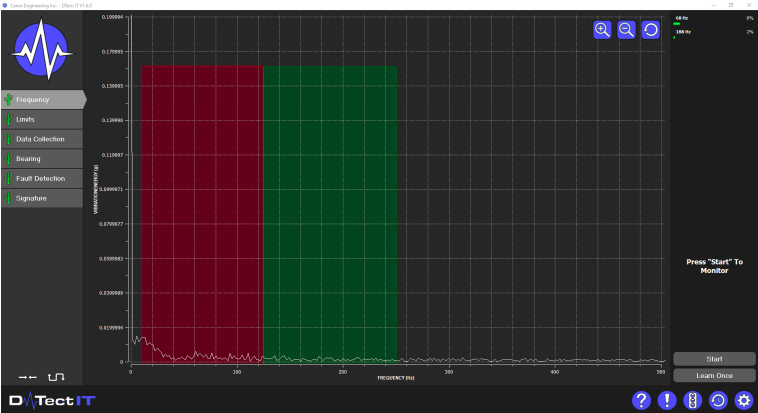
The Frequency Analysis user interface displays an FFT graph of the associated sensor signal. The FFT graph displays vibration energy (g) over frequency (Hz). The Frequency Analysis user interface can be seen in Figure 6-1. The following buttons and features are available in the Frequency Analysis user interface:
- Start: Press to begin the Frequency Analysis. The analysis can also be started using a CNC command or physical I/O.
- Stop: Press to stop the Frequency Analysis. The analysis can also be stopped using a CNC command or physical I/O.
- Reset: Resets the live graph and clears any active alarms
- Learn Once: Flag to run the analysis in a Learn mode. This automatically determines the range magnitudes for monitoring. Learn once is only available if enabled in the settings.
Performing a Frequency Analysis
To perform a Frequency Analysis, start by determining the frequencies that need to be monitored. For each frequency to be monitored, a range needs to be created in the frequency analysis settings menu. Use the following steps to create a range (s):
- Navigate to the Ranges Tab in the Frequency Analysis settings
- Press the Create Range button and enter the following parameters:
- Name: Enter a name for the range
- Auto Position: If checked, the next range created is automatically positioned at the end of the previous range.
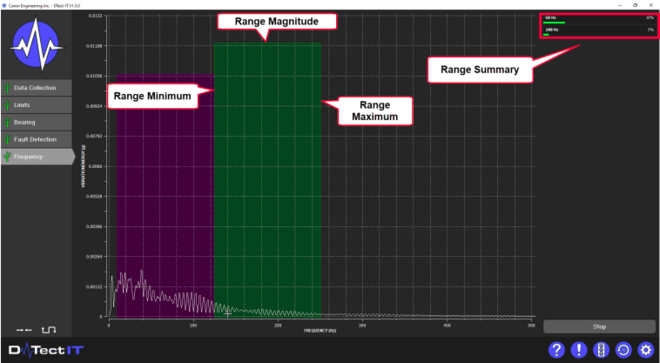
- Min: Sets the minimum frequency in Hz for the Range
- Max: Sets the maximum frequency in HZ for the Range
- Magnitude: The amount in g's that triggers an alarm for the Range o Learn Auto-Scale %: The percentage used to determine range magnitude automatically when using the Learn Once feature. Range Magnitude = Peak value + (Peak Value*Auto-scale%)
- Alarm Type: Sets the alarm type for the range.
- Color: Sets a color to represent the range on the user interface
- Repeat steps 1 and 2 until a range is created for every frequency that needs to be monitored.
Note: It is recommended to utilize the learn once feature to set magnitudes automatically.
Once ranges are created, start the analysis. After the analysis starts, a list of the monitored ranges appears in the Range Summary on the right side of the interface. Pressing a range from the list highlights it on the graph.
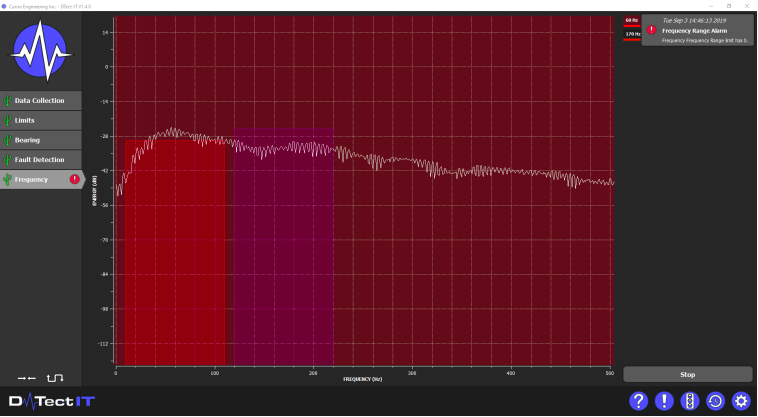
When the magnitude of the signal FFT exceeds (over alarm type) or fails to exceed (under alarm type) the set magnitude of the monitored range, an alarm is triggered.
Using Learn Once to Set Range Magnitudes
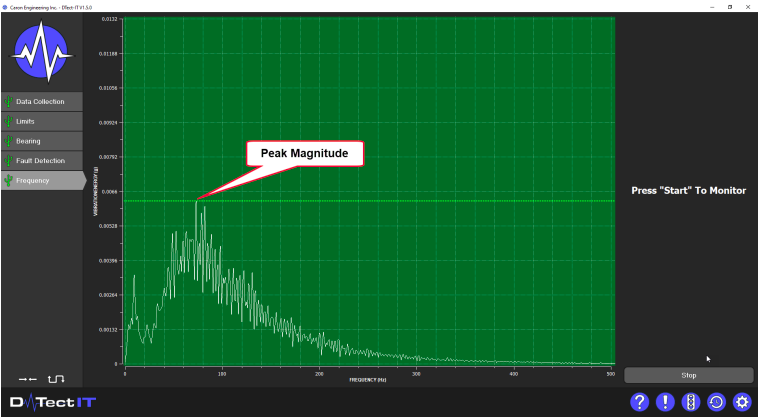
Frequency analysis allows range magnitudes to be determined automatically with the Learn Once feature. To utilize Learn Once, it must first be enabled in the analysis settings menu. Once learn is enabled, pressing the Learn Once button prompts DTect-IT to enter Learn mode the next time the frequency analysis is started. Prior to starting the analysis, all desired ranges should be created in the settings. If a range is added after learning range magnitudes, the process will need to be learned again. When the analysis is started, the background color of the live graph changes to green and DTect-IT begins monitoring the signal FFT for the peak value.
Once the process is complete, press the Stop button to end the analysis. Range magnitudes are calculated using the peak of the FT signal and an Auto-scale percentage set by the user in the analysis settings.
Alarm Types for Frequency Analysis
Alarm types determine how the frequency analysis triggers an alarm condition based on the magnitude of the signal value. The following alarm types are available:
- Over: An alarm condition occurs when the magnitude of the signal value exceeds the magnitude set for the range. If the magnitude of the signal value returns below the magnitude set for the range, the analysis leaves the alarm condition.
- Over Latching: An alarm condition occurs when the magnitude of the signal value exceeds the magnitude set for the range. The analysis remains in the alarm condition until reset.
- Under: An alarm condition occurs when the magnitude of the signal value falls below the magnitude set for the range. If the magnitude of the signal value returns above the magnitude set for the range, the analysis leaves the alarm condition.
- Under Latching: An alarm condition occurs when the magnitude of the signal value falls below the magnitude set for the range. The analysis remains in the alarm condition until reset.
Frequency Analysis Settings
In the Frequency Analysis settings menu, the following can be programmed no matter which tab is open:
- Name: Change the analysis name in this field.
- Enabled: Enables or disables the analysis. Disabling the analysis will remove it from the list of analyses in the main user interface, but will not delete the analysis.
- Notifications: Enables or disables notifications for the analysis. Disabling notifications prevents notifications for the analysis from being stored in the Notification Center.
Graph Tab
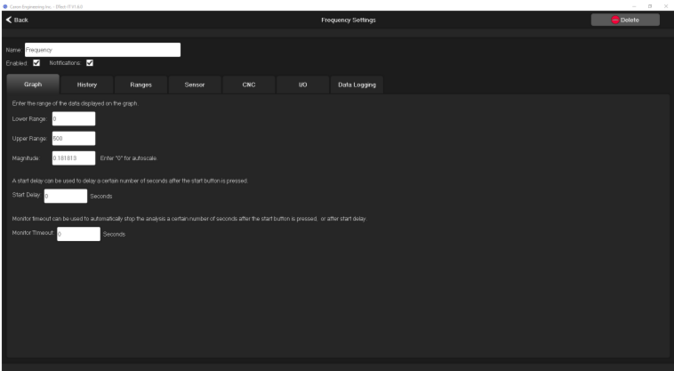
The following parameters can be set in the Graph tab:
- Upper and Lower Ranges: Defines the range of frequencies displayed on the horizontal axis.
- Magnitude: Defines the vertical axis range. Entering "0" automatically scales the axis
- Start Delay: Delays the start of the analysis by a set number of seconds. If the start button is pressed the analysis will start after the programmed amount of time has passed.
- Monitor Timeout: Allows the analysis to stop monitoring after a set period of time. When DTect-IT receives a start command, the monitor timeout begins. DTect-IT monitors and records signal data for the time period set in this field
Ranges Tab
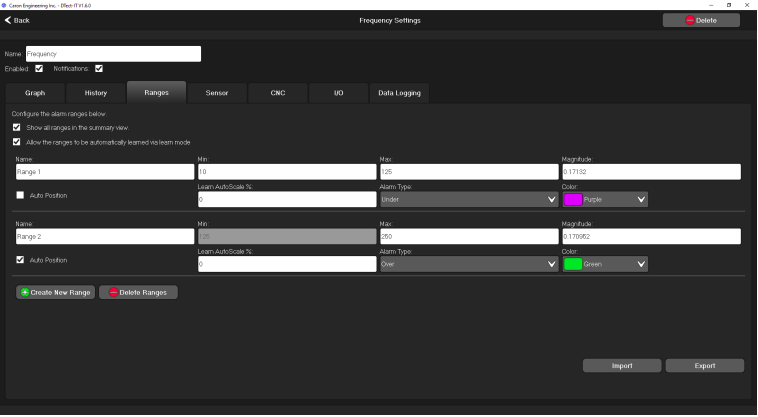
The following parameters can be set in the Ranges tab:
- Show all ranges in the summary view: When checked, all ranges are displayed in the range summary on the right hand-side of the interface. When left unchecked only ranges with the Show in Summary check-box marked appear in the range summary.
- Learn Mode: Enabling Learn mode allows DTect-IT to determine range magnitudes for a process automatically, when the process is run in Learn mode. For more information refer to "Using Learn Once to Set Range Magnitudes" (page 92)
- Create New Range: Adds a range to the list of configurable ranges. See "Performing a Frequency Analysis" (page 91) for more information.
- Delete Ranges: Allows the user to select and delete a range
- Import: Imports a .csv (commma seperated value) file to create multiple ranges at once
- Export: Exports the list of created ranges to a csv file for a backup
Sensor Tab
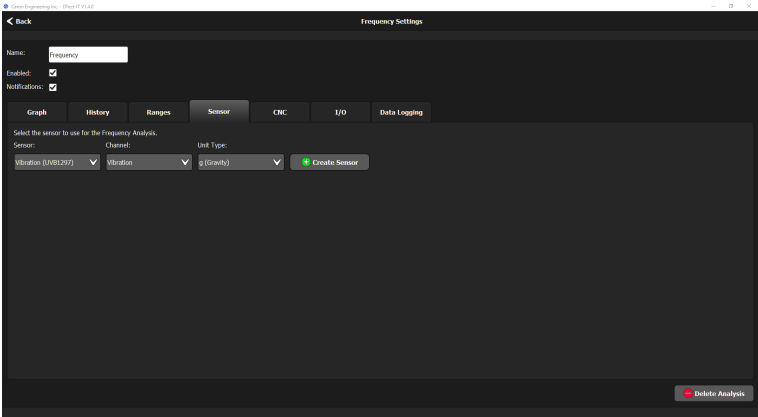
The following parameters can be set in the Sensor Tab:
- Sensor: Choose the Sensor to be utilized by the analysis, or create a new sensor using the Create Sensor Button.
CNC Tab
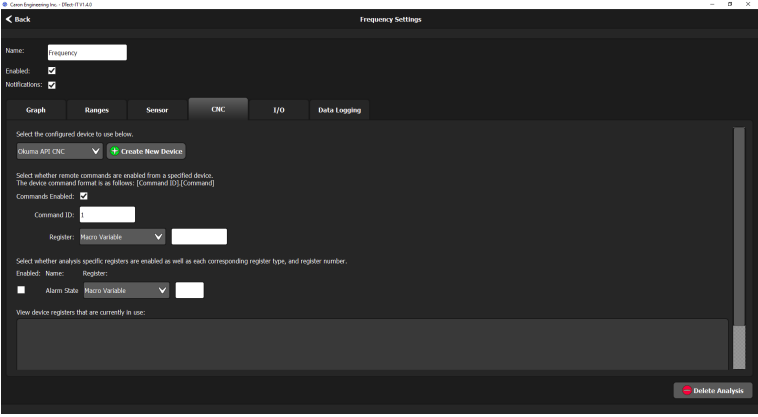
The following parameters can be set in the CNC Configuration tab:
- Device: Select a CNC from the drop-down menu. If a CNC has not been created, use the create button to open the wizard for the desired CNC.
- Commands Enabled: Check the box to enable communication between the analysis and the specified CNC device.
- Command ID: The integer value used to send commands from the CNC to the analysis.
- Register: Specify the register type and a variable to send CNC commands through. The device registers and I/O in use by DTect-IT can be viewed in the field at the bottom of this tab.
- Enable analysis specific variables and source: Press the check boxes to enable more analysis specific information to be written to the CNC. Select which register and variable DTect-IT should use when writing data to the CNC. The following can be enabled for frequency analysis:
- Acknowledge: The acknowledge register is populated with the corresponding value when the analysis is started or stopped.
- Alarm State: Writes the alarm status of the analysis to the specified variable. A 1 signifies the analysis is in an alarm state. A 0 signifies no alarm
- Alarm Range: Signifies which range is in an alarm state.
- Range Minimum: Writes the range minimum for the range most recently in alarm. o Range Maximum:Writes the range maximum for the range most recently in alarm.
Alarm and Command Codes for Frequency Analysis
CNC Commands and Command Returns
I/O Tab
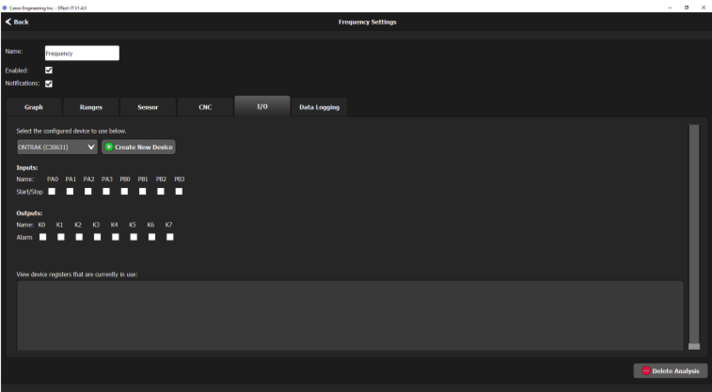
The following parameters can be set in the I/O tab:
- Device: Assign an I/O device to the analysis. If one has not been created yet, one can be created using the Create New Device button.
- Inputs: Assign analysis features to specific inputs. When the Inputs are toggled, the analysis feature mapped to the input is activated. The following features can be mapped to inputs for frequency analysis:
- Start/Stop: When this feature is mapped to an input and the input is turned on, the analysis will start running. When turned off, the analysis will stop.
- Outputs: Assign analysis features to specific outputs. The following features can be mapped to outputs for frequency analysis:
- Acknowledge: The acknowledge output bit turns on when the analysis is started and the bit turns off when the analysis is stopped.
- Alarm: When an alarm is triggered, the mapped output turns on.
Note: The I/O device must be configured and connected to a USB port on the PC that DTect-IT is installed for any I/O parameters to be accessed in DTect-IT.
Data Logging Tab
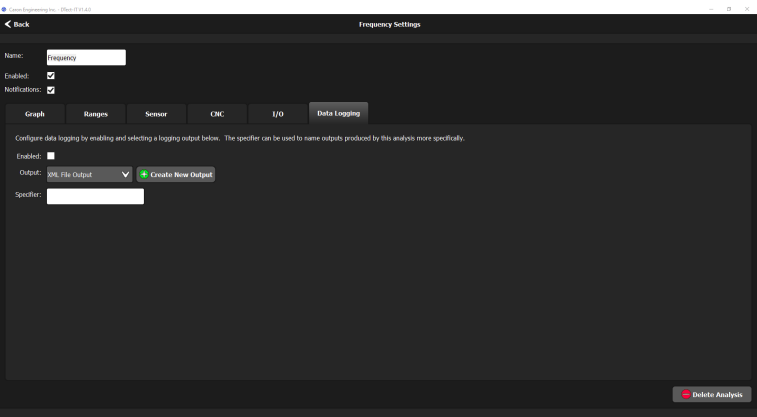
The following parameters can be set in the Data Logging Tab:
- Enabled: Enables data logging for the analysis.
- Output: Specify the type of data file output. If an output has not been created yet, one can be created using the create button.
- Specifier: A specifier is added to the file naming convention when log files are generated for the analysis. This allows the data files for specific analyses to be organized separately from the normal naming convention.
- Detailed Output: Adds dates and time stamps to outputs
Frequency Analysis History View
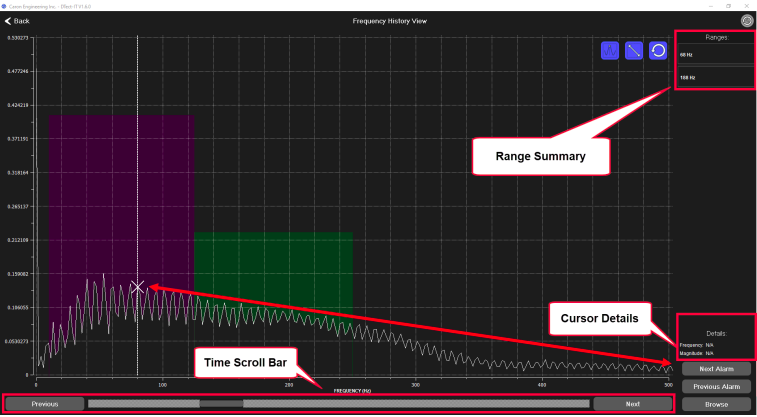
If frequency analysis is selected in the main user interface and History View is enabled in the settings, pressing the History View button will open a screen displaying the most recent record of the frequency analysis. Each monitored range is listed on the right-hand side of the interface. Selecting a range from the list highlights the range on the graph.
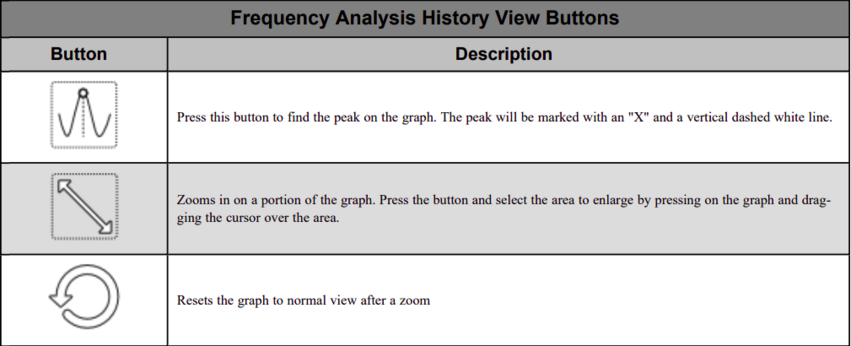
Clicking on the graph places a cursor that provides frequency and magnitude data at cursor location. The cursor is marked with an "X" in the figure above. The horizontal scroll bar allows quick selection of a specific time in the recording to review magnitude and frequency data. Alternatively, the Previous and Next buttons may be used to incrementally step through various times in the recording.
Note: Due to a redesign of the database structure, all historical data will not be backwards compatible with any existing 1.5.x and below versions of DTect-IT. It is recommended all old data is backed up after install of DTect-IT 1.6.0.
Frequency History Selection
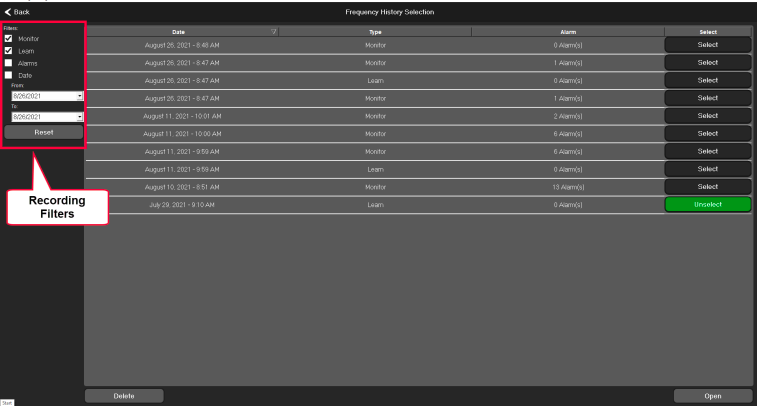
Press the BROWSE button in the history view to open a list of all recordings of the frequency analysis. Each recording listed displays the date and time of the analysis, type of recording, and the number of alarms that occurred. The list of recordings can be filtered using the filter options on the left side of the window. Recordings can be filtered by the following:
- Monitor: Check to display all monitor type recordings
- Learn: Check to display all learn type recordings
- Alarms: Check to display only recordings that contain alarms
- Date: Enter a date range using the drop-down menus. Only recordings within the selected range are displayed. Any combination of filters may be used to filter the list.
Opening Frequency Recordings
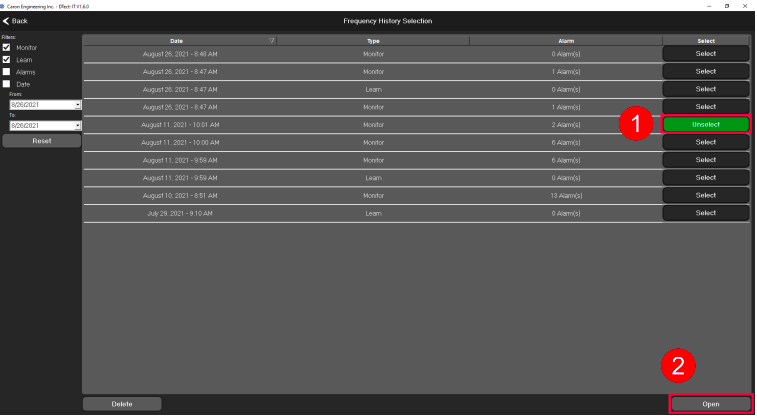
Use the following steps to open a frequency recording:
- Select a recording from the list
- Press the Open button
Deleting Frequency History Results
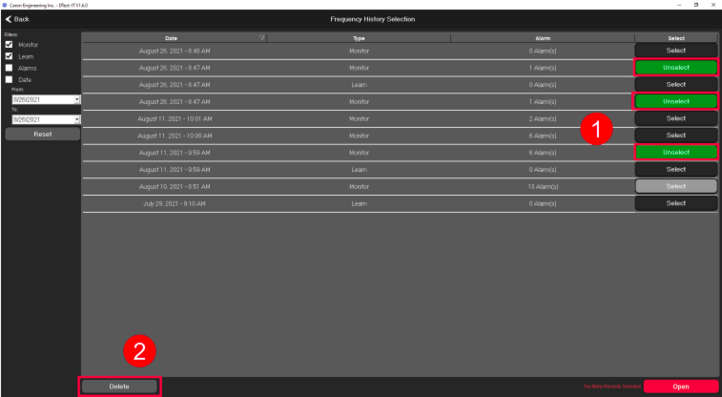
Use the following steps to delete frequency recordings
- Select a recording(s) from the list
- Press the Delete button
- Press Yes
