Overview
The Fault Detection analysis monitors machining processes against extreme thresholds to detect and log events such as machine crashes, tool breaks and excessive temperatures. This analysis type can be password protected by a supervisor to prevent changes from being made after set up.
Fault Detection Wizard
The Fault Detection Analysis wizard eases the setup of a Fault Detection Analysis by guiding the user through the settings step by step. To set up a new Fault Detection Analysis, click the Create button in the General Settings menu and select Fault Detection. This launches the Fault Detection Analysis Wizard. Perform the following steps in the wizard to create the analysis:
- Press Begin.
- Select or Create a new sensor for the analysis to utilize.
- Select a Channel and Unit Type from the drop down menu.
- Select a filtering mode.
- Use the sliders to choose how long data should be recorded before and after each latched alarm.
- Enable password protection, if desired. If password protection is enabled, enter a password as well.
- Enter a name for the analysis and Press Finish.
After finishing the analysis, the Fault Detection analysis settings menu will be opened.
Fault Detection User Interface
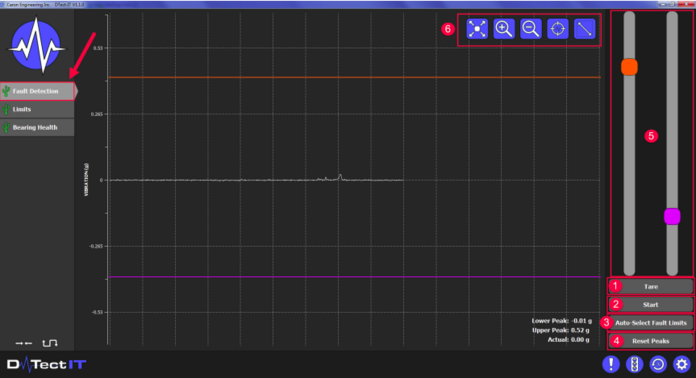
The Fault Detection analysis user interface displays one live graph for monitoring data in real time. When running a Fault Detection analysis, DTect-IT tests the measured data against user programmed fault limits. Two fault limits can be programmed for Fault Detection, Upper and Lower. If the monitored data falls below or exceeds the fault limits, an alarm is triggered and latched. Data is only recorded for the programmed amount of time before and after an alarm is latched. The following buttons and features are available in the Fault Detection analysis user interface:
- Tare: Adjusts the current sensor signal to zero. This allows the user to eliminate unwanted idle data. (1)
- Start: Press to begin the Fault Detection analysis. DTect-IT prompts the user to confirm locking the fault thresholds. (2)
- Auto Select Fault Limits: Press to automatically place fault limits based on the current measured peaks. Use this feature to quickly snap the fault limits around the peaks and make adjustments from there. (3)
- Reset Peaks: DTect-IT stores and displays two peak values and the actual measured value on the live graph. Pressing the Reset Peaks button, resets the stored upper and lower peaks to the actual measured value. (4)
- Fault Limit Sliders: Moves the fault limits on the graph up and down for quick setting. (5)
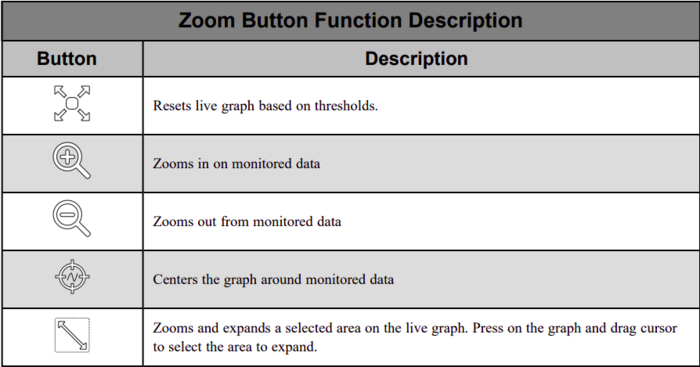
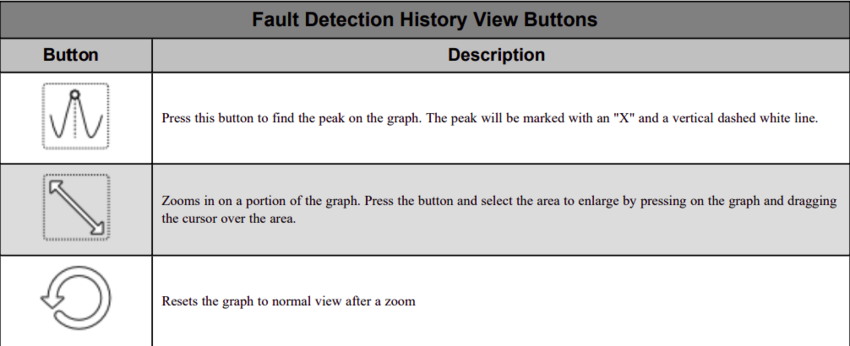
- Zoom Tools: See table for description of zoom tools. (6)
Fault Detection User Interface After Start
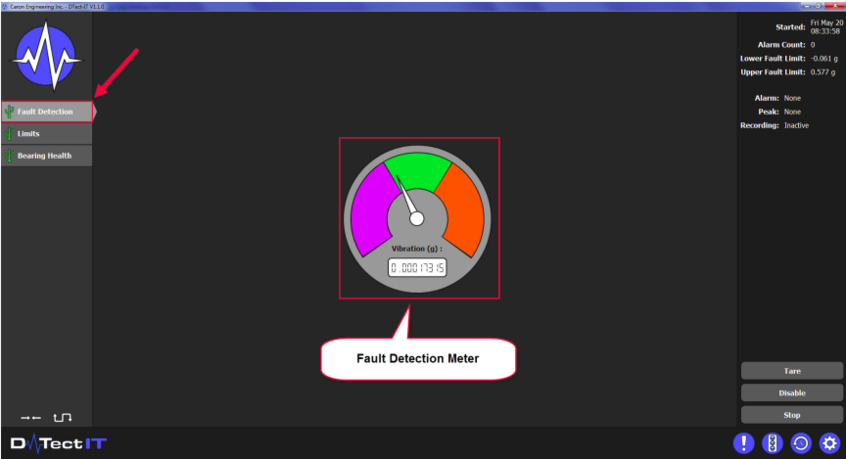
Once the start button is pressed and fault limits locked, the Fault Detection User interface changes.
After the user interface change, the following buttons are available:
- Stop: Press to stop the Fault Detection analysis and return to the default user interface.
- Disable: Disables the fault detection meter. The sensor will still run but alarms won't be triggered.
Note: If password protection is enabled, the programmed password must be entered to use any button after the analysis is started.
Performing a Fault Detection Analysis
To perform a Fault Detection Analysis, start by setting fault limits. This can be done with the slider bars in the user interface, or a numerical value can be set in the settings menu for the analysis. Run the machining process without starting the analysis to understand how the monitored data will be affected by the fault limits. Adjust the fault limits to represent values the would occur for extreme machining situations, like crashes or tool breaks. Press Start to begin monitoring data against the programmed fault limits. Once a fault detection is started, DTect-IT will monitor the measured data against the set fault limits until the Stop or Disable button is pressed.
When the analysis starts, a meter replaces the live graph in the user interface. The meter displays the current monitored value numerically and visually. As a part program runs, the needle will move in between the two thresholds representing the current monitored value.
If a threshold is crossed, an alarm is triggered and latched. Data will be recorded for a set period of time before and after the alarm.
Fault Detection: After an Alarm Triggers
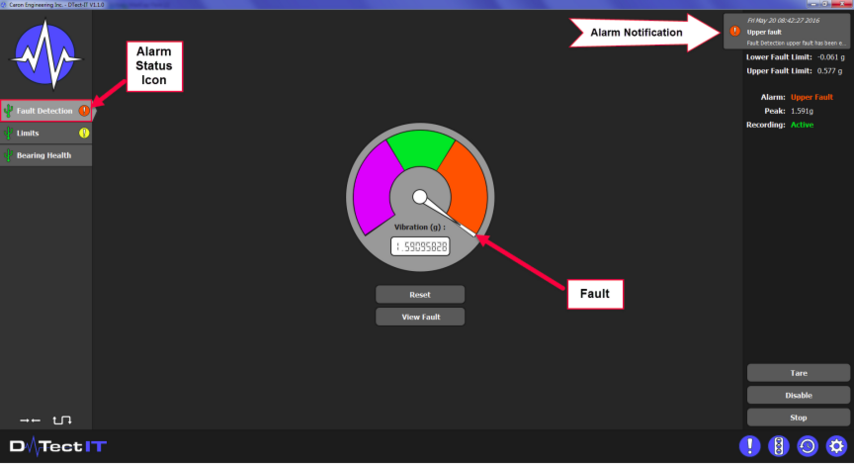
After an alarm is triggered, two new buttons appear in the user interface:
- Reset: Resets the fault detection meter to clear the alarm.
Note: If password protection is enabled, the programmed password must be entered to use the Reset button.
- View Fault: Opens the History View for the analysis with the most recent fault open.
If a fault is not reset, DTect-IT will continue to record each additional fault. In addition to the fault detection meter, data can be viewed in the right hand panel of the user interface. The following data are displayed:
- Started: Date and time the analysis was started.
- Alarm Count: The number of faults that have occurred.
- Upper Fault: The programmed upper fault threshold.
- Lower Fault: The programmed lower fault threshold.
- Alarm: Displays the alarm status of the analysis.
- Peak: Displays the peak value recorded during the fault.
- Recording: Displays the recording status of the analysis, Active or Inactive.
Status Icons
In the analysis tab for a Fault Detection, icons will appear based on the alarm status of the analysis. When the analysis is running if a fault threshold is exceeded an icon will appear in the analysis tab.
Fault Detection Settings
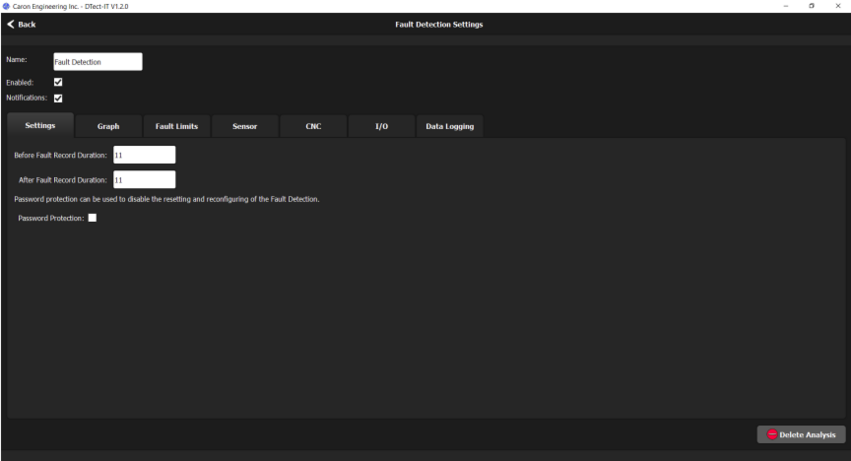
In the Fault Detection settings menu, the following parameters can be programmed no matter which tab is open:
- Name: Change the analysis name in this field.
- Enabled: Enables or disables the analysis. Disabling the analysis will remove it from the list of analyses in the main user interface, but will not delete the analysis.
- Notifications: Enables or disables notifications for the analysis. Disabling notifications prevents notifications for the analysis from being stored in the Notification Center.
Settings Tab
The following parameters can be set in the Settings tab:
- Before Fault Record Duration: The time period DTect-IT records data before a latched alarm. The range is 1 second to 15 seconds.
- After Fault Record Duration: The time period DTect-IT records data after a latched alarm. The range is 1 second to 15 seconds.
- Password Protection: If password protection is enabled, set a password in the field. The buttons in the fault detection user interface and settings menu become password protected.
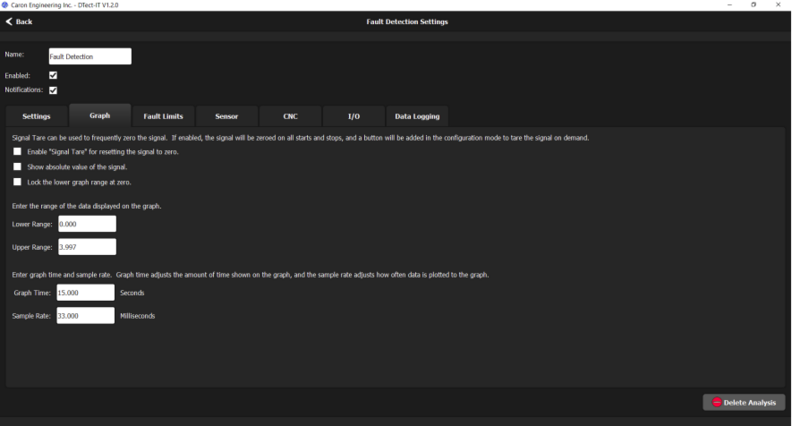
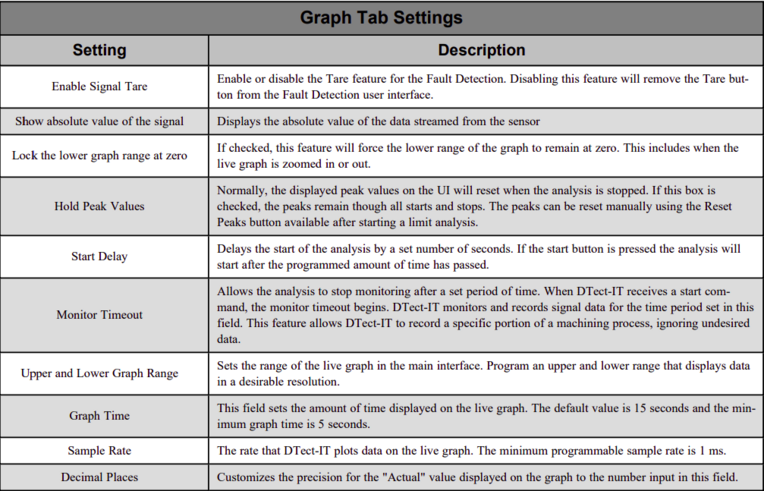
Graph Tab
The table below describes the graph tab settings for Fault Detection:
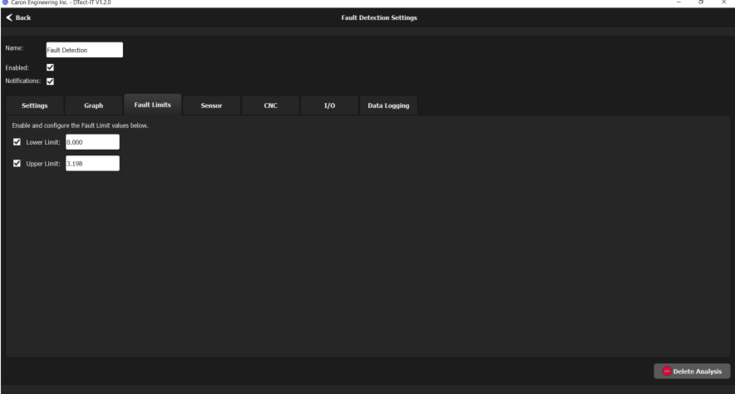
Fault Limits Tab
The following parameters can be set in the Faults tab:
- Lower Limit: Enter a numerical value for the lower fault limit. The value entered in this field is the value that the measured data must fall below to trigger and latch a lower alarm (purple).
- Upper Limit: Enter a numerical value for the upper fault limit. The value entered in this field is the value that the measured data must exceed to trigger and latch an upper alarm (orange).
- Enable/Disable Fault Limits: The check-boxes next to each fault limit determine if a limit is enabled or disabled. By default each fault limit is enabled. Press the check-box to remove the check and disable the limit. Press the check-box again to re-enable the limit. When a fault limit is disabled, the slider bar for the associated limit will be removed from the interface and the fault limit will not be displayed on the live graph or fault detection meter
Note: Fault limits can also be set using the slider bars in the fault detection user interface.
Sensor Tab
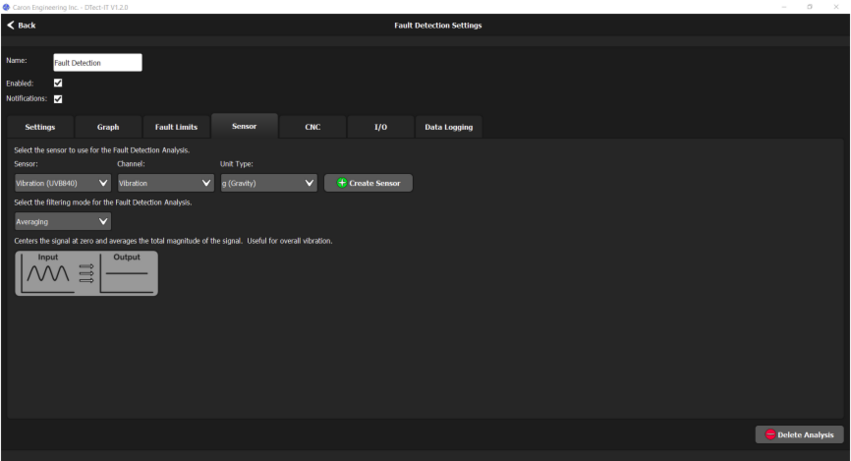
The following parameters can be set in the Sensor Tab:
- Sensor: Choose the Sensor to be utilized by the analysis, or create a new sensor using the Create Sensor button.
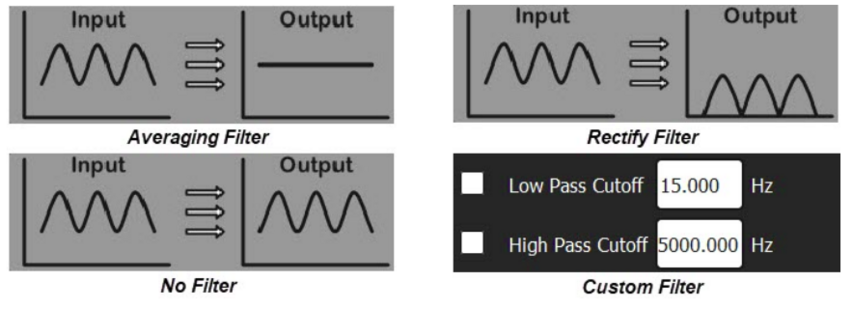
- Filtering mode: Select a data filter from the drop-down list. The following filters are available:
- Averaging Filter: Centers the signal at zero and averages the total magnitude of the signal. This filter is useful for overall vibration.
- Rectify Peaks Filter: Centers the signal at zero and shows the absolute value of the signal. Useful for looking for high peaks in any direction.
- No Filter: Displays raw signal data.
- Custom Filter: Creates a custom filter by allowing the user to set low pass and/or a high pass cutoff frequencies to be applied to the signal. Check the box(es) to enable one or both of the cutoff frequencies. Then set the frequency(Hz) in the field to the right for each frequency cutoff enabled.
CNC Tab
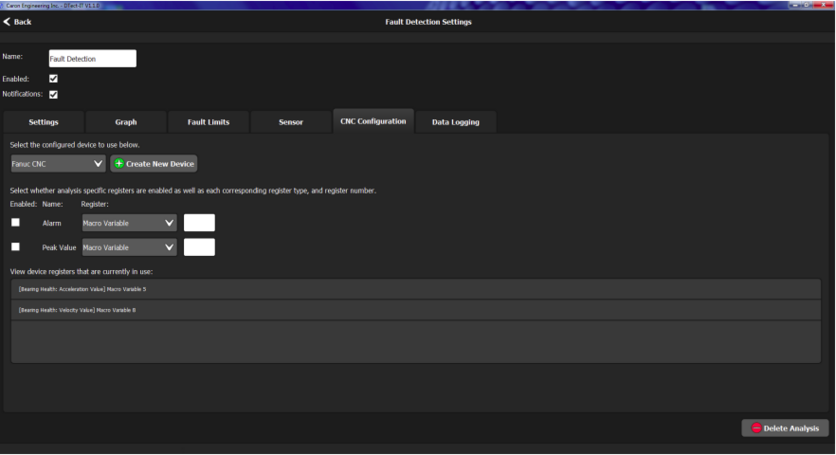
The following parameters can be set in the CNC Configuration tab:
- Device: Select a CNC from the drop-down menu. If a CNC has not been created, use the create button to open the wizard for the desired CNC.
- Enable analysis specific variables and source: Press the check boxes to enable more analysis specific information to be written to the CNC. Select which register and variable DTect-IT should use when writing data to the CNC. The following can be enabled for fault detection:
- Acknowledge: The acknowledge register is populated with the corresponding value when the analysis is started or stopped.
- Alarm: Writes the alarm status of the analysis to the specified variable.
- Peak Value: Writes the highest recorded value to the specified variable
Alarm and Command Codes for Fault Detection
CNC Commands and Command Returns
CNC commands are currently unavailable for Fault Detection.
I/O Tab
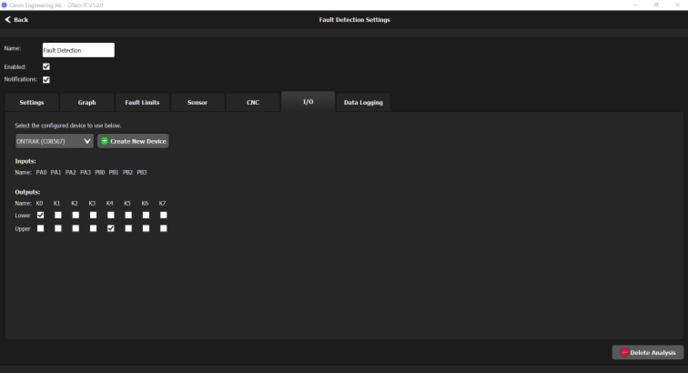
The following parameters can be set in the I/O tab:
- Device: Assign an I/O device to the analysis. If one has not been created yet, one can be created using the Create New Device button.
- Inputs: There are no inputs available for Fault Detection.
- Outputs: Assign analysis features to specific outputs. The following features can be mapped to outputs for fault detection:
- Acknowledge: The acknowledge output bit turns on when the analysis is started and the bit turns off when the analysis is stopped.
- Lower Fault Limit (Purple): When a lower fault is triggered, the mapped output turns on.
- Upper Fault Limit (Orange): When an upper fault is triggered, the mapped output turns on. Note: The I/O device must be configured and connected to a USB port on the PC that DTect-IT is installed for any I/O parameters to be accessed in DTect-IT.
Data Logging
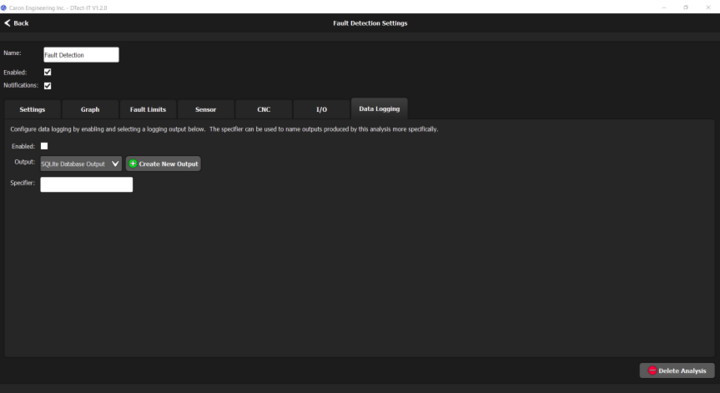
The following parameters can be set in the Data Logging Tab:
- Enabled: Enables data logging for the analysis.
- Output: Specify the type of data file output. If an output has not been created yet, one can be created using the create button.
- Specifier: A specifier is added to the file naming convention when log files are generated for the analysis. This allows the data files for specific analyses to be organized separately from the normal naming convention.
- Detailed Output: Adds dates and time stamps to outputs
Fault Detection History View
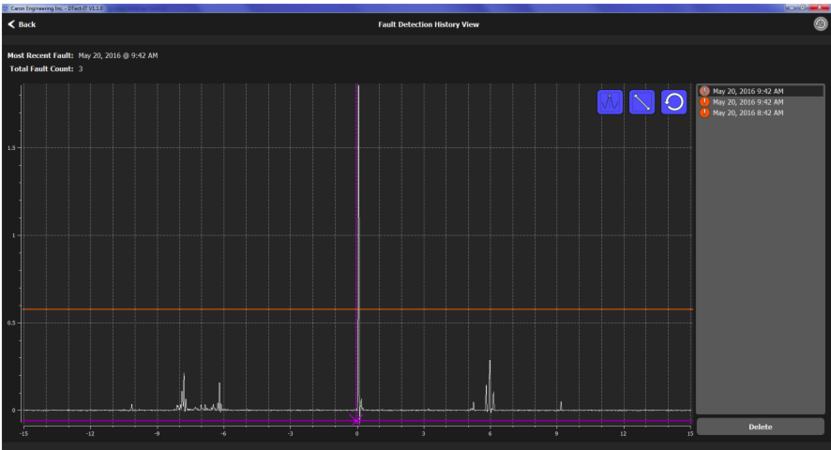
If a Fault Detection analysis is selected in the main user interface, pressing the History View button will open a screen displaying a record of faults that occurred for that analysis.
If History view is enabled, each fault that occurs is recorded by DTect-IT. In the History View screen, the faults that have occurred for the analysis are listed on the right. Pressing on a fault displays a graph of the recorded fault. In a Fault Detection analysis, data is recorded before and after the actual fault based on the settings. The moment the fault occurred is marked by a vertical dashed red line and "X". The fault thresholds are marked on the graph by horizontal lines.
Note: Due to a redesign of the database structure, all historical data will not be backwards compatible with any existing 1.5.x and below versions of DTect-IT. It is recommended all old data is backed up after install of DTect-IT 1.6.0.
